X-Y-Z Scatter Plot in Excel with UNISTAT
The UNISTAT statistics add-in extends Excel with X-Y-Z Scatter Plot capabilities.
For further information visit UNISTAT User's Guide section 4.2.1. X-Y-Z Scatter Plot.
Here we provide a sample output from the UNISTAT Excel statistics add-in for data analysis.
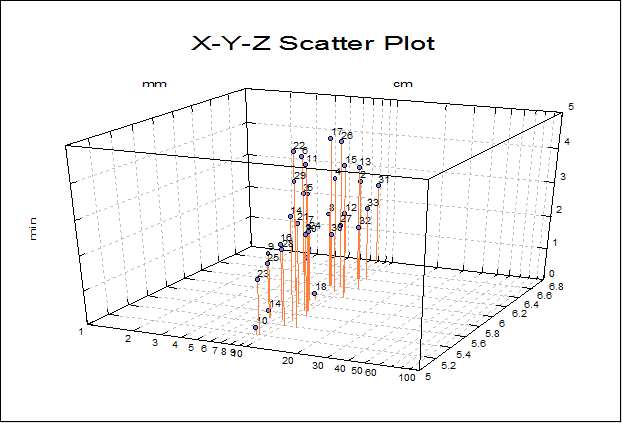
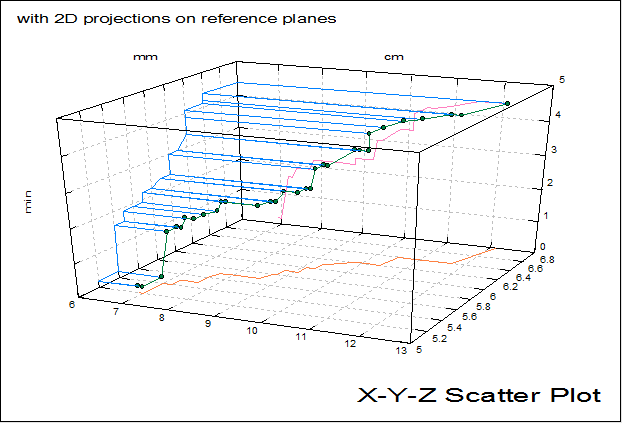
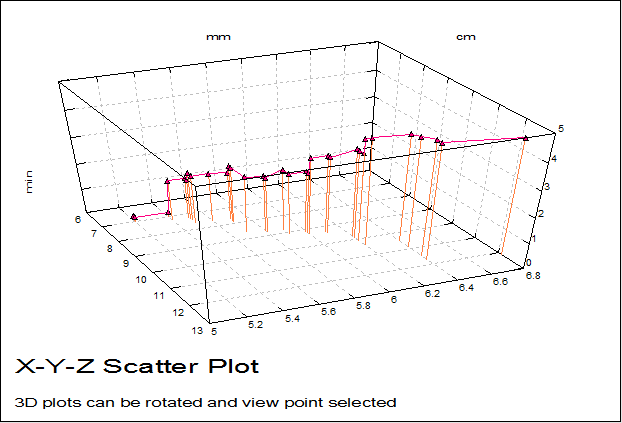
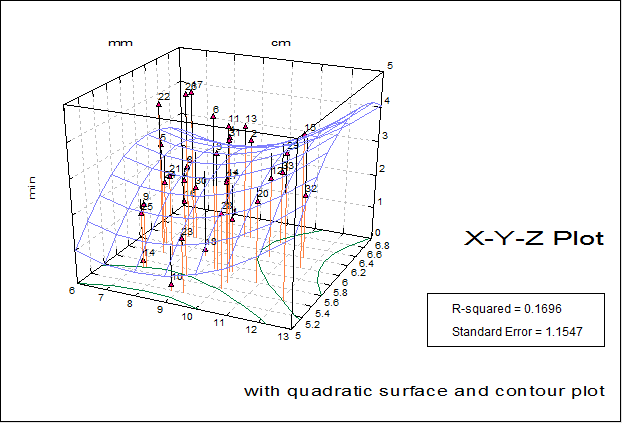
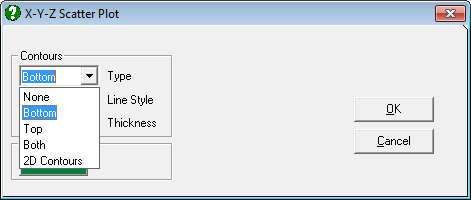
X-Y-Z Scatter Plot