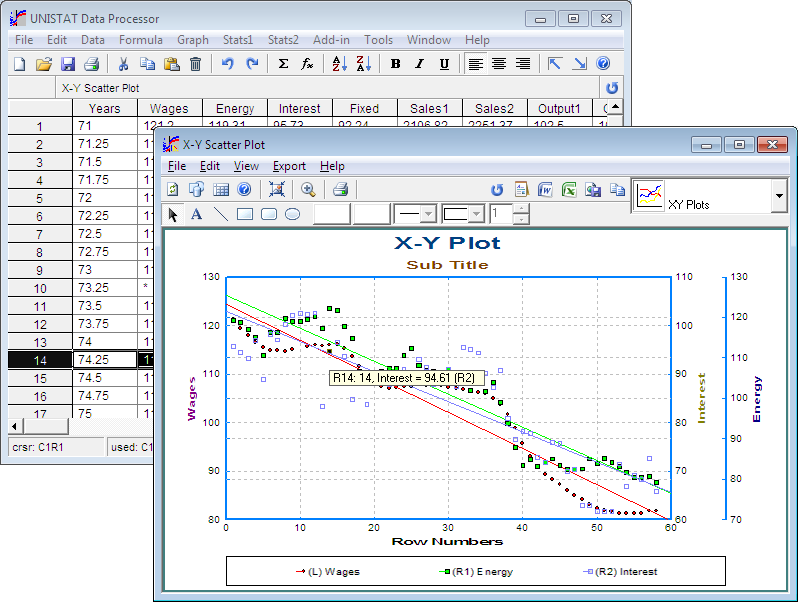
X-Y Plots in Excel with UNISTAT
The UNISTAT statistics add-in extends Excel with X-Y Plots capabilities.
For further information visit UNISTAT User's Guide section 4.1.1. X-Y Plots.
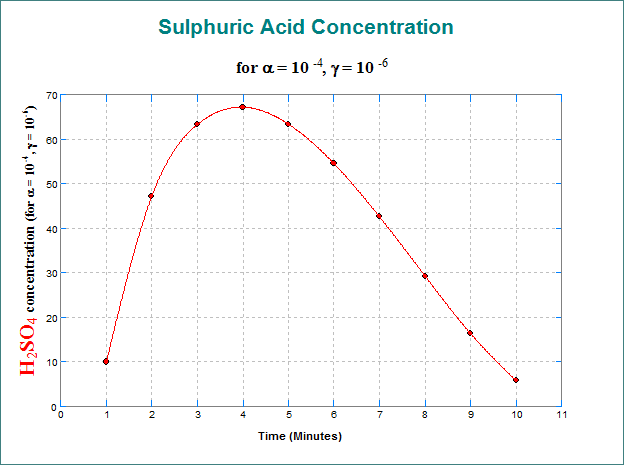
Here we provide a sample output from the UNISTAT Excel statistics add-in for data analysis.
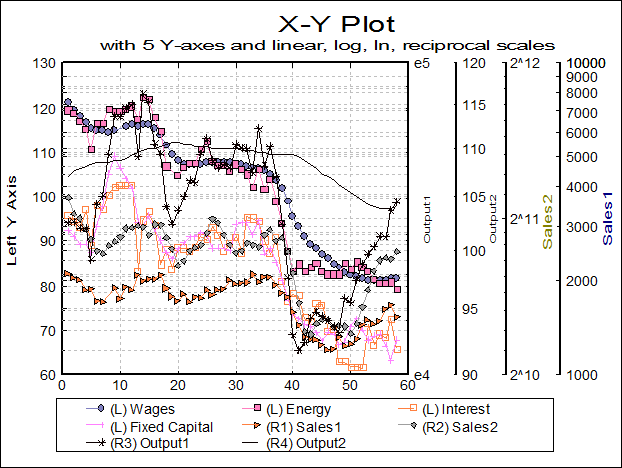
X-Y Plots
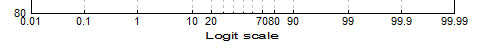
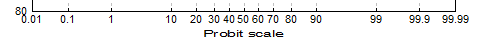
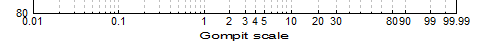
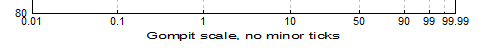
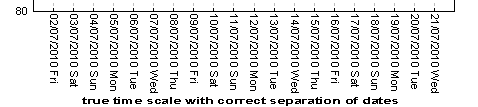
Axis Scaling Options


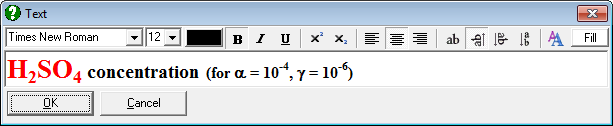
Text Formatting
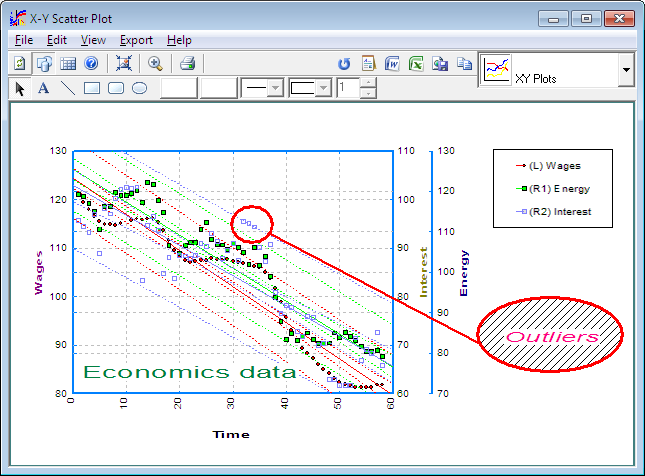
Multiple Y-Axes
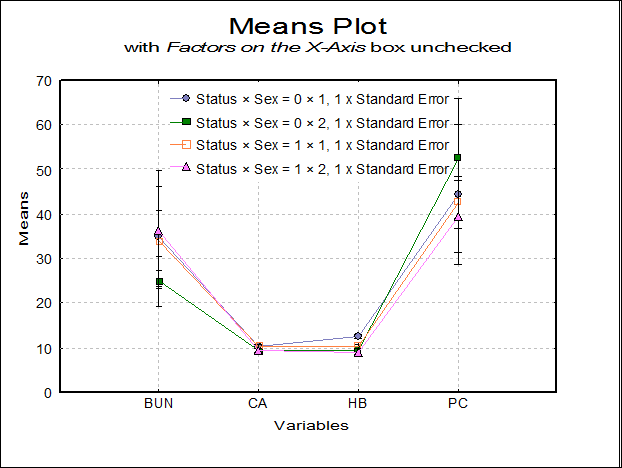
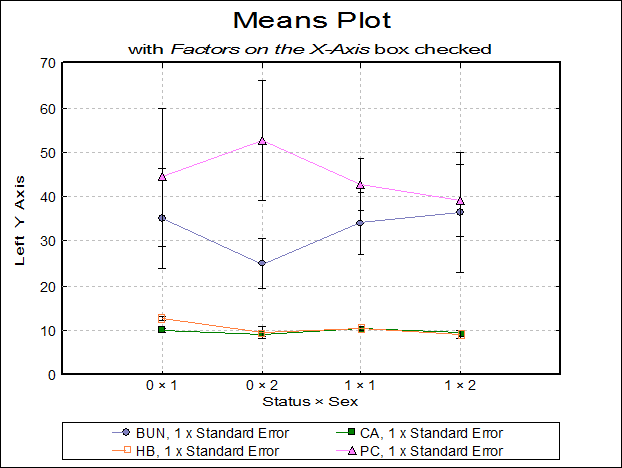
Means Plot
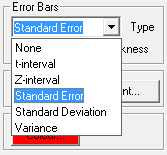
Error Bars
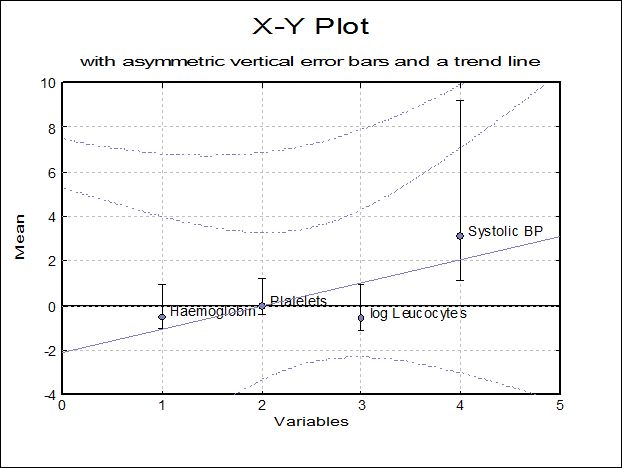
Trend Lines
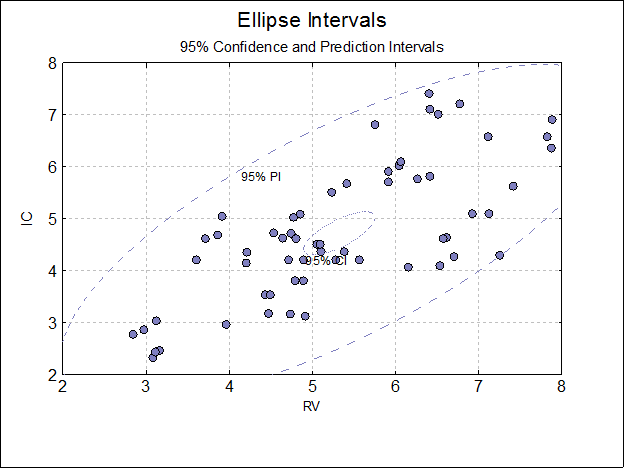
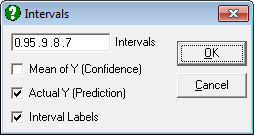
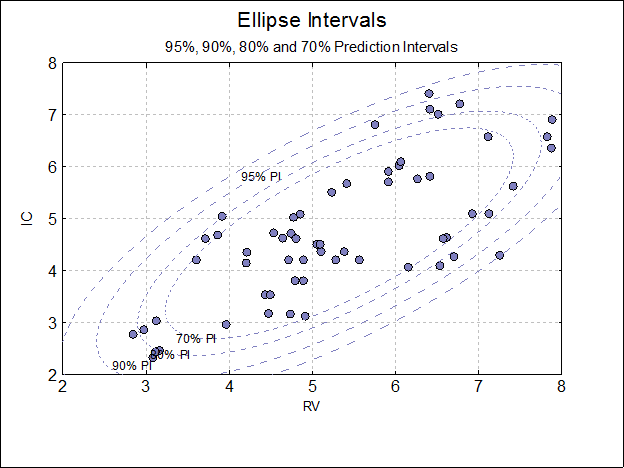
Ellipse Confidence and Prediction Intervals
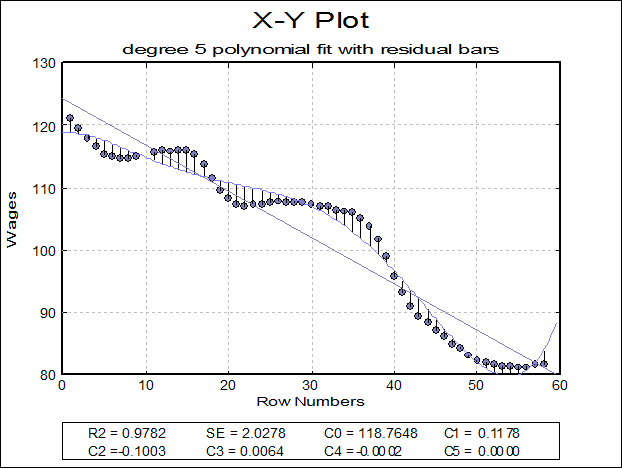
Curve Fitting
Interactive Graphics