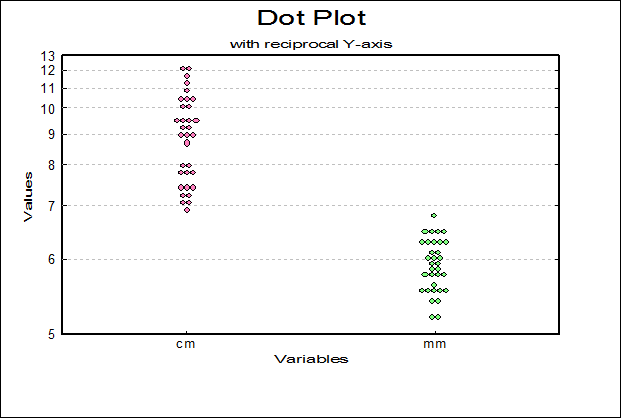
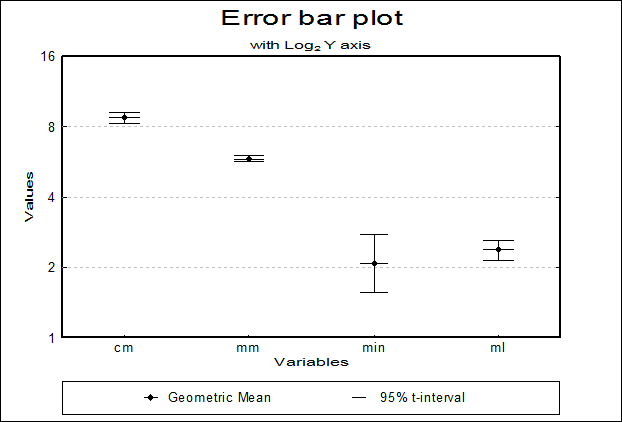
Box-Whisker, Dot and Bar Plots in Excel with UNISTAT
The UNISTAT statistics add-in extends Excel with Box-Whisker, Dot and Bar Plots capabilities.
For further information visit UNISTAT User's Guide section 5.3.1. Box-Whisker, Dot and Bar Plots.
Here we provide a sample output from the UNISTAT Excel statistics add-in for data analysis.
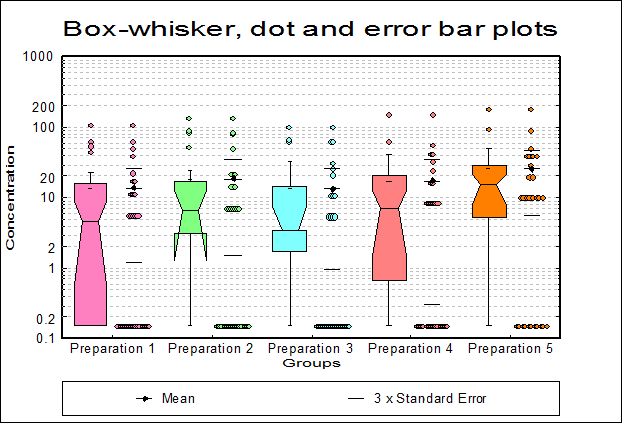
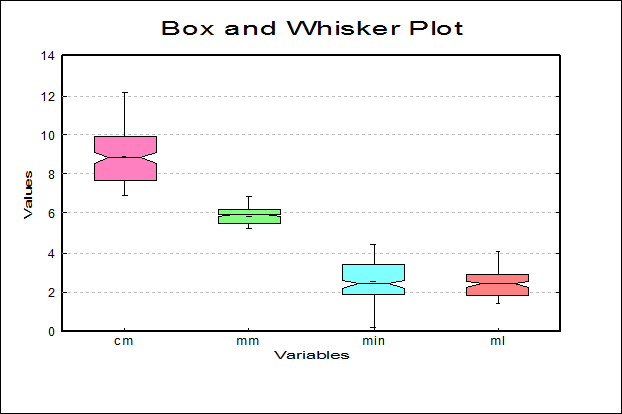
Box-Whisker, Dot and Bar Plots