Logistic Regression in Excel with UNISTAT
The UNISTAT statistics add-in extends Excel with Logistic Regression capabilities.
For further information visit UNISTAT User's Guide section 7.2.6. Logistic Regression.
Here we provide a sample output from the UNISTAT Excel statistics add-in for data analysis.
Logistic Regression
Dependent Variable: GRADE
Minimum of dependent variable is encoded as 0 and the rest as 1.
Valid Number of Cases: 32, 0 Omitted
Regression Coefficients
| Coefficient | Standard Error | Wald Statistic | Probability | Lower 95% | Upper 95% | |
|---|---|---|---|---|---|---|
| Constant | -13.0213 | 4.9313 | 6.9724 | 0.0083 | -22.6866 | -3.3561 |
| GPA | 2.8261 | 1.2629 | 5.0074 | 0.0252 | 0.3508 | 5.3014 |
| TUCE | 0.0952 | 0.1416 | 0.4519 | 0.5014 | -0.1823 | 0.3726 |
| PSI | 2.3787 | 1.0646 | 4.9926 | 0.0255 | 0.2922 | 4.4652 |
Goodness of Fit Tests
| -2 Log likelihood | |
|---|---|
| Initial Model | 41.1835 |
| Final Model | 25.7793 |
| Chi-Square Statistic | Degrees of Freedom | Right-Tail Probability | |
|---|---|---|---|
| Pearson | 27.2571 | 27 | 0.4500 |
| Likelihood Ratio | 15.4042 | 3 | 0.0015 |
| Hosmer-Lemeshow | 7.4526 | 8 | 0.4887 |
| Pseudo R-squared | |
|---|---|
| McFadden | 0.3740 |
| Adjusted McFadden | 0.1798 |
| Cox & Snell | 0.3821 |
| Nagelkerke | 0.5278 |
Correlation Matrix of Regression Coefficients
| Constant | GPA | TUCE | PSI | |
|---|---|---|---|---|
| Constant | 1.0000 | -0.7343 | -0.4960 | -0.4494 |
| GPA | -0.7343 | 1.0000 | -0.2065 | 0.3181 |
| TUCE | -0.4960 | -0.2065 | 1.0000 | 0.0990 |
| PSI | -0.4494 | 0.3181 | 0.0990 | 1.0000 |
Covariance Matrix of Regression Coefficients
| Constant | GPA | TUCE | PSI | |
|---|---|---|---|---|
| Constant | 24.3180 | -4.5735 | -0.3463 | -2.3592 |
| GPA | -4.5735 | 1.5950 | -0.0369 | 0.4276 |
| TUCE | -0.3463 | -0.0369 | 0.0200 | 0.0149 |
| PSI | -2.3592 | 0.4276 | 0.0149 | 1.1333 |
Odds Ratio
| Odds Ratio | Standard Error | Lower 95% | Upper 95% | |
|---|---|---|---|---|
| GPA | 16.8797 | 21.3181 | 1.4202 | 200.6239 |
| TUCE | 1.0998 | 0.1557 | 0.8334 | 1.4515 |
| PSI | 10.7907 | 11.4874 | 1.3393 | 86.9380 |
Hosmer-Lemeshow Table
| Actual Y = 0 | Expected Y = 0 | Actual Y = 1 | Expected Y = 1 | Total | |
|---|---|---|---|---|---|
| 1 | 4 | 3.8965 | 0 | 0.1035 | 4 |
| 2 | 3 | 2.8964 | 0 | 0.1036 | 3 |
| 3 | 3 | 2.8353 | 0 | 0.1647 | 3 |
| 4 | 2 | 2.7165 | 1 | 0.2835 | 3 |
| 5 | 2 | 2.4295 | 1 | 0.5705 | 3 |
| 6 | 4 | 2.7678 | 0 | 1.2322 | 4 |
| 7 | 1 | 1.4199 | 2 | 1.5801 | 3 |
| 8 | 1 | 1.1139 | 2 | 1.8861 | 3 |
| 9 | 0 | 0.6265 | 3 | 2.3735 | 3 |
| 10 | 1 | 0.2977 | 2 | 2.7023 | 3 |
Case (Diagnostic) Statistics
Minimum of dependent variable is encoded as 0 and the rest as 1.
| Actual Y | Fitted Y | Predicted Group | Leverage | Cook’s Distance | Deviance | Residuals | Standardised Residuals | |
|---|---|---|---|---|---|---|---|---|
| 1 | 0.0000 | 0.0266 | 0.0000 | 0.0390 | 0.0011 | -0.2321 | -0.0266 | -0.1652 |
| 2 | 0.0000 | 0.0595 | 0.0000 | 0.0545 | 0.0036 | -0.3503 | -0.0595 | -0.2515 |
| 3 | 0.0000 | 0.1873 | 0.0000 | 0.0889 | 0.0225 | -0.6440 | -0.1873 | -0.4800 |
| 4 | 0.0000 | 0.0259 | 0.0000 | 0.0807 | 0.0023 | -0.2291 | -0.0259 | -0.1631 |
| 5 | 1.0000 | 0.5699 | 1.0000 | 0.3289 | 0.3698 | 1.0605 | 0.4301 | 0.8687 |
| 6 | 0.0000 | 0.0349 | 0.0000 | 0.0549 | 0.0021 | -0.2664 | -0.0349 | -0.1900 |
| 7 | 0.0000 | 0.0265 | 0.0000 | 0.0458 | 0.0013 | -0.2318 | -0.0265 | -0.1650 |
| 8 | 0.0000 | 0.0516 | 0.0000 | 0.0512 | 0.0029 | -0.3254 | -0.0516 | -0.2332 |
| 9 | 0.0000 | 0.1111 | 0.0000 | 0.0853 | 0.0117 | -0.4854 | -0.1111 | -0.3536 |
| 10 | 1.0000 | 0.6935 | 1.0000 | 0.2861 | 0.1771 | 0.8556 | 0.3065 | 0.6648 |
| 11 | 0.0000 | 0.0245 | 0.0000 | 0.0376 | 0.0010 | -0.2226 | -0.0245 | -0.1584 |
| 12 | 0.0000 | 0.1900 | 0.0000 | 0.0869 | 0.0223 | -0.6492 | -0.1900 | -0.4843 |
| 13 | 0.0000 | 0.3222 | 0.0000 | 0.1312 | 0.0718 | -0.8820 | -0.3222 | -0.6895 |
| F- 14 | 1.0000 | 0.1932 | 0.0000 | 0.1002 | 0.4650 | 1.8133 | 0.8068 | 2.0434 |
| 15 | 0.0000 | 0.3610 | 0.0000 | 0.1540 | 0.1028 | -0.9464 | -0.3610 | -0.7516 |
| 16 | 0.0000 | 0.0302 | 0.0000 | 0.0428 | 0.0014 | -0.2476 | -0.0302 | -0.1764 |
| 17 | 0.0000 | 0.0536 | 0.0000 | 0.0690 | 0.0042 | -0.3320 | -0.0536 | -0.2380 |
| 18 | 0.0000 | 0.0386 | 0.0000 | 0.0487 | 0.0021 | -0.2805 | -0.0386 | -0.2003 |
| F+ 19 | 0.0000 | 0.5899 | 1.0000 | 0.1085 | 0.1751 | -1.3351 | -0.5899 | -1.1993 |
| 20 | 1.0000 | 0.6608 | 1.0000 | 0.1303 | 0.0769 | 0.9103 | 0.3392 | 0.7165 |
| 21 | 0.0000 | 0.0614 | 0.0000 | 0.1263 | 0.0095 | -0.3559 | -0.0614 | -0.2557 |
| 22 | 1.0000 | 0.9048 | 1.0000 | 0.1109 | 0.0131 | 0.4472 | 0.0952 | 0.3243 |
| 23 | 0.0000 | 0.2418 | 0.0000 | 0.3215 | 0.1511 | -0.7440 | -0.2418 | -0.5647 |
| F+ 24 | 0.0000 | 0.8521 | 1.0000 | 0.1080 | 0.6972 | -1.9551 | -0.8521 | -2.4002 |
| 25 | 1.0000 | 0.8383 | 1.0000 | 0.0992 | 0.0213 | 0.5940 | 0.1617 | 0.4392 |
| 26 | 1.0000 | 0.4811 | 1.0000 | 0.2782 | 0.4157 | 1.2096 | 0.5189 | 1.0385 |
| 27 | 1.0000 | 0.6354 | 1.0000 | 0.2835 | 0.2270 | 0.9523 | 0.3646 | 0.7575 |
| 28 | 0.0000 | 0.3072 | 0.0000 | 0.1852 | 0.1008 | -0.8568 | -0.3072 | -0.6659 |
| 29 | 1.0000 | 0.8417 | 1.0000 | 0.1303 | 0.0282 | 0.5871 | 0.1583 | 0.4337 |
| 30 | 1.0000 | 0.9453 | 1.0000 | 0.0853 | 0.0054 | 0.3353 | 0.0547 | 0.2405 |
| F+ 31 | 0.0000 | 0.5291 | 1.0000 | 0.1171 | 0.1490 | -1.2273 | -0.5291 | -1.0600 |
| F- 32 | 1.0000 | 0.1110 | 0.0000 | 0.1299 | 1.1953 | 2.0966 | 0.8890 | 2.8296 |
| Logit Residuals | Studentised Residuals | Delta-Beta Constant | Delta-Beta GPA | Delta-Beta TUCE | Delta-Beta PSI | |||
| 1 | -1.0273 | -0.2368 | -0.1446 | 0.0296 | 0.0012 | 0.0255 | ||
| 2 | -1.0633 | -0.3602 | -0.2192 | 0.0488 | 0.0008 | 0.0500 | ||
| 3 | -1.2304 | -0.6747 | -0.2069 | 0.0468 | -0.0028 | 0.1231 | ||
| 4 | -1.0266 | -0.2389 | -0.1918 | 0.0101 | 0.0060 | 0.0262 | ||
| 5 | 1.7547 | 1.2945 | -0.7994 | 0.6609 | -0.0469 | -0.2150 | ||
| 6 | -1.0361 | -0.2740 | -0.1974 | 0.0236 | 0.0041 | 0.0326 | ||
| 7 | -1.0272 | -0.2373 | -0.1614 | 0.0222 | 0.0030 | 0.0257 | ||
| 8 | -1.0544 | -0.3340 | -0.2131 | 0.0419 | 0.0017 | 0.0445 | ||
| 9 | -1.1250 | -0.5075 | -0.2192 | 0.0806 | -0.0052 | 0.0839 | ||
| 10 | 1.4419 | 1.0126 | -1.5677 | 0.2612 | 0.0387 | -0.1075 | ||
| 11 | -1.0251 | -0.2269 | -0.1364 | 0.0284 | 0.0011 | 0.0238 | ||
| 12 | -1.2346 | -0.6794 | -0.2435 | 0.0265 | 0.0017 | 0.1241 | ||
| 13 | -1.4754 | -0.9463 | -0.0099 | -0.1007 | 0.0064 | 0.1816 | ||
| F- 14 | 5.1757 | 1.9116 | 0.6743 | -0.2661 | 0.0308 | -0.5311 | ||
| 15 | -1.5649 | -1.0289 | 0.3538 | -0.0414 | -0.0189 | 0.1971 | ||
| 16 | -1.0311 | -0.2531 | -0.1642 | 0.0285 | 0.0021 | 0.0285 | ||
| 17 | -1.0567 | -0.3441 | -0.1777 | 0.0640 | -0.0031 | 0.0467 | ||
| 18 | -1.0401 | -0.2876 | -0.1945 | 0.0309 | 0.0028 | 0.0351 | ||
| F+ 19 | -2.4383 | -1.4141 | 0.1815 | 0.0123 | -0.0095 | -0.2986 | ||
| 20 | 1.5133 | 0.9761 | -0.4484 | -0.0112 | 0.0206 | 0.1943 | ||
| 21 | -1.0654 | -0.3808 | -0.3456 | 0.1175 | -0.0023 | 0.0012 | ||
| 22 | 1.1052 | 0.4743 | -0.4594 | 0.0636 | 0.0103 | 0.0792 | ||
| 23 | -1.3189 | -0.9032 | -1.3875 | 0.0189 | 0.0561 | -0.0779 | ||
| F+ 24 | -6.7609 | -2.0700 | 2.9581 | -0.4707 | -0.0574 | -0.6331 | ||
| 25 | 1.1929 | 0.6258 | -0.4563 | 0.1103 | 0.0034 | 0.1159 | ||
| 26 | 2.0784 | 1.4238 | -0.2394 | -0.4520 | 0.0756 | 0.2781 | ||
| 27 | 1.5738 | 1.1251 | 0.2892 | 0.3224 | -0.0590 | 0.2429 | ||
| 28 | -1.4435 | -0.9492 | -0.5420 | 0.2916 | -0.0192 | -0.1032 | ||
| 29 | 1.1881 | 0.6295 | -0.3651 | 0.1639 | -0.0082 | 0.1180 | ||
| 30 | 1.0578 | 0.3506 | -0.2569 | 0.0828 | -0.0011 | 0.0495 | ||
| F+ 31 | -2.1237 | -1.3061 | -0.3054 | -0.0140 | 0.0150 | -0.2474 | ||
| F- 32 | 9.0065 | 2.2477 | 4.5458 | -1.0577 | -0.0397 | 0.0812 |
F+: False Positive
F-: False Negative
2 x 2 Table
| Estimated \ Actual | Positive | Negative | Total |
|---|---|---|---|
| Positive | 9 | 3 | 12 |
| 81.82% | 14.29% | ||
| Negative | 2 | 18 | 20 |
| 18.18% | 85.71% | ||
| Total | 11 | 21 | 32 |
| 100.00% | 100.00% |
| Classification Threshold Probability | 0.4211 |
|---|
Statistics for Diagnostic Tests
Confidence Intervals: Row 1: Asymptotic Normal, Row 2: Exact Binomial
| Value | Standard Error | Lower 95% | Upper 95% | |
|---|---|---|---|---|
| Sensitivity | 0.8182 | 0.1163 | 0.5903 | 1.0000 |
| 0.4822 | 0.9772 | |||
| Specificity | 0.8571 | 0.0764 | 0.7075 | 1.0000 |
| 0.6366 | 0.9695 | |||
| Accuracy | 0.8438 | 0.0642 | 0.7179 | 0.9696 |
| 0.6721 | 0.9472 | |||
| Prevalence | 0.3438 | 0.0840 | 0.1792 | 0.5083 |
| 0.1857 | 0.5319 | |||
| Apparent Prevalence | 0.3750 | 0.0856 | 0.2073 | 0.5427 |
| 0.2110 | 0.5631 | |||
| Youden’s Index | 0.6753 | |||
| 0.1188 | 0.9467 | |||
| Positive Predictive Value | 0.7500 | 0.1250 | 0.5050 | 0.9950 |
| 0.4281 | 0.9451 | |||
| Negative Predictive Value | 0.9000 | 0.0671 | 0.7685 | 1.0000 |
| 0.6830 | 0.9877 | |||
| Positive Likelihood Ratio | 5.7273 | 1.9371 | 16.9334 | |
| Negative Likelihood Ratio | 0.2121 | 0.0596 | 0.7547 | |
| Diagnostic Odds Ratio | 27.0000 | 3.8033 | 191.6750 | |
| Weighted Positive Likelihood Ratio | 3.0000 | 1.0678 | 8.4284 | |
| Weighted Negative Likelihood Ratio | 0.1111 | 0.0295 | 0.4183 |
Logistic Regression
Dependent Variable: GRADE
Minimum of dependent variable is encoded as 0 and the rest as 1.
Valid Number of Cases: 32, 0 Omitted
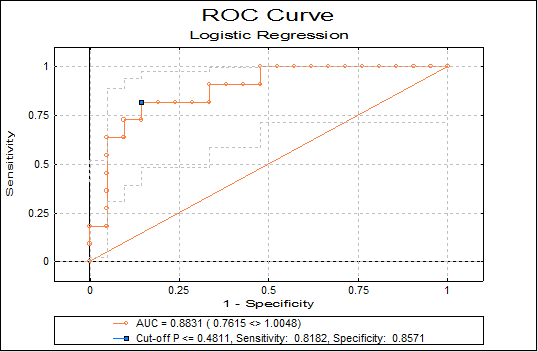
Area Under the Curve
| AUC | Standard Error | Z-Statistic | 1-Tail Probability | 2-Tail Probability | Lower 95% | Upper 95% | |
|---|---|---|---|---|---|---|---|
| 0.8831 | 0.0621 | 6.1721 | 0.0000 | 0.0000 | 0.7615 | 1.0048 |
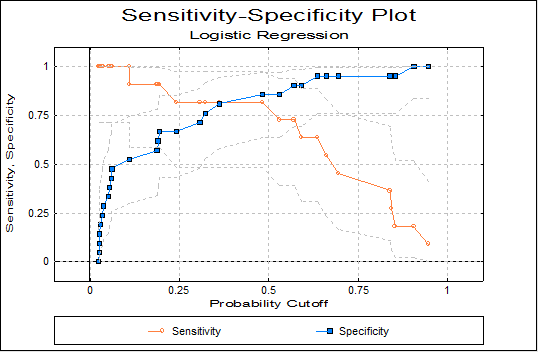
ROC Table
* marks the best cut-off case.
Optimality criterion: Max(Sensitivity + Specificity)
Confidence Intervals: Asymptotic Normal
| Cut-off P <= | Sensitivity | Lower 95% | Upper 95% | Specificity | Lower 95% | Upper 95% | |
|---|---|---|---|---|---|---|---|
| 1 | 0.9453 | 0.0909 | 0.0000 | 0.2608 | 1.0000 | 1.0000 | 1.0000 |
| 2 | 0.9048 | 0.1818 | 0.0000 | 0.4097 | 1.0000 | 1.0000 | 1.0000 |
| 3 | 0.8521 | 0.1818 | 0.0000 | 0.4097 | 0.9524 | 0.8613 | 1.0000 |
| 4 | 0.8417 | 0.2727 | 0.0095 | 0.5359 | 0.9524 | 0.8613 | 1.0000 |
| 5 | 0.8383 | 0.3636 | 0.0794 | 0.6479 | 0.9524 | 0.8613 | 1.0000 |
| 6 | 0.6935 | 0.4545 | 0.1603 | 0.7488 | 0.9524 | 0.8613 | 1.0000 |
| 7 | 0.6608 | 0.5455 | 0.2512 | 0.8397 | 0.9524 | 0.8613 | 1.0000 |
| 8 | 0.6354 | 0.6364 | 0.3521 | 0.9206 | 0.9524 | 0.8613 | 1.0000 |
| 9 | 0.5899 | 0.6364 | 0.3521 | 0.9206 | 0.9048 | 0.7792 | 1.0000 |
| 10 | 0.5699 | 0.7273 | 0.4641 | 0.9905 | 0.9048 | 0.7792 | 1.0000 |
| 11 | 0.5291 | 0.7273 | 0.4641 | 0.9905 | 0.8571 | 0.7075 | 1.0000 |
| * 12 | 0.4811 | 0.8182 | 0.5903 | 1.0000 | 0.8571 | 0.7075 | 1.0000 |
| 13 | 0.3610 | 0.8182 | 0.5903 | 1.0000 | 0.8095 | 0.6416 | 0.9775 |
| 14 | 0.3222 | 0.8182 | 0.5903 | 1.0000 | 0.7619 | 0.5797 | 0.9441 |
| 15 | 0.3072 | 0.8182 | 0.5903 | 1.0000 | 0.7143 | 0.5211 | 0.9075 |
| 16 | 0.2418 | 0.8182 | 0.5903 | 1.0000 | 0.6667 | 0.4650 | 0.8683 |
| 17 | 0.1932 | 0.9091 | 0.7392 | 1.0000 | 0.6667 | 0.4650 | 0.8683 |
| 18 | 0.1900 | 0.9091 | 0.7392 | 1.0000 | 0.6190 | 0.4113 | 0.8267 |
| 19 | 0.1873 | 0.9091 | 0.7392 | 1.0000 | 0.5714 | 0.3598 | 0.7831 |
| 20 | 0.1111 | 0.9091 | 0.7392 | 1.0000 | 0.5238 | 0.3102 | 0.7374 |
| 21 | 0.1110 | 1.0000 | 1.0000 | 1.0000 | 0.5238 | 0.3102 | 0.7374 |
| 22 | 0.0614 | 1.0000 | 1.0000 | 1.0000 | 0.4762 | 0.2626 | 0.6898 |
| 23 | 0.0595 | 1.0000 | 1.0000 | 1.0000 | 0.4286 | 0.2169 | 0.6402 |
| 24 | 0.0536 | 1.0000 | 1.0000 | 1.0000 | 0.3810 | 0.1733 | 0.5887 |
| 25 | 0.0516 | 1.0000 | 1.0000 | 1.0000 | 0.3333 | 0.1317 | 0.5350 |
| 26 | 0.0386 | 1.0000 | 1.0000 | 1.0000 | 0.2857 | 0.0925 | 0.4789 |
| 27 | 0.0349 | 1.0000 | 1.0000 | 1.0000 | 0.2381 | 0.0559 | 0.4203 |
| 28 | 0.0302 | 1.0000 | 1.0000 | 1.0000 | 0.1905 | 0.0225 | 0.3584 |
| 29 | 0.0266 | 1.0000 | 1.0000 | 1.0000 | 0.1429 | 0.0000 | 0.2925 |
| 30 | 0.0265 | 1.0000 | 1.0000 | 1.0000 | 0.0952 | 0.0000 | 0.2208 |
| 31 | 0.0259 | 1.0000 | 1.0000 | 1.0000 | 0.0476 | 0.0000 | 0.1387 |
| 32 | 0.0245 | 1.0000 | 1.0000 | 1.0000 | 0.0000 | 0.0000 | 0.0000 |
| Range of best Classification Threshold Probability | 0.3610 <> 0.4811 |
|---|
Logistic Regression
Dependent Variable: GRADE
Minimum of dependent variable is encoded as 0 and the rest as 1.
Valid Number of Cases: 32, 0 Omitted
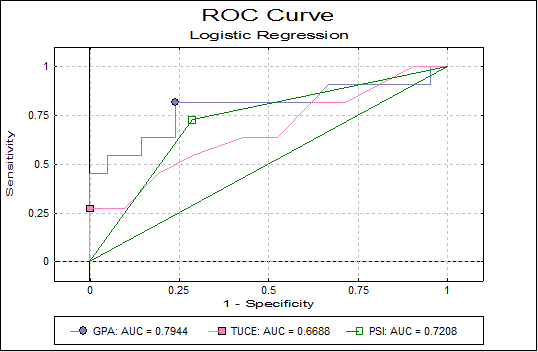
Area Under the Curve
| AUC | Standard Error | Z-Statistic | 1-Tail Probability | 2-Tail Probability | Lower 95% | Upper 95% | |
|---|---|---|---|---|---|---|---|
| GPA | 0.7944 | 0.1001 | 2.9421 | 0.0016 | 0.0033 | 0.5983 | 0.9905 |
| TUCE | 0.6688 | 0.1075 | 1.5702 | 0.0582 | 0.1164 | 0.4581 | 0.8796 |
| PSI | 0.7208 | 0.0867 | 2.5477 | 0.0054 | 0.0108 | 0.5509 | 0.8906 |
Correlation Matrix of Areas
| GPA | TUCE | PSI | |
|---|---|---|---|
| GPA | 1.0000 | 0.2215 | -0.2182 |
| TUCE | 0.2215 | 1.0000 | -0.0997 |
| PSI | -0.2182 | -0.0997 | 1.0000 |
Covariance Matrix of Areas
| GPA | TUCE | PSI | |
|---|---|---|---|
| GPA | 0.0100 | 0.0024 | -0.0019 |
| TUCE | 0.0024 | 0.0116 | -0.0009 |
| PSI | -0.0019 | -0.0009 | 0.0075 |
Multiple Comparisons for Areas
| Difference | Standard Error | Z-Statistic | 1-Tail Probability | 2-Tail Probability | Lower 95% | Upper 95% | Chi-Square Statistic | |
|---|---|---|---|---|---|---|---|---|
| GPA – TUCE | 0.1255 | 0.1296 | 0.9684 | 0.1664 | 0.3328 | -0.1285 | 0.3796 | 0.9378 |
| GPA – PSI | 0.0736 | 0.1460 | 0.5042 | 0.3071 | 0.6141 | -0.2125 | 0.3597 | 0.2542 |
| TUCE – PSI | -0.0519 | 0.1447 | 0.3591 | 0.3598 | 0.7195 | -0.3355 | 0.2316 | 0.1289 |
| Right-Tail Probability | ||||||||
| GPA – TUCE | 0.3328 | |||||||
| GPA – PSI | 0.6141 | |||||||
| TUCE – PSI | 0.7195 |