Factor Analysis in Excel with UNISTAT
The UNISTAT statistics add-in extends Excel with Factor Analysis capabilities.
For further information visit UNISTAT User's Guide section 8.5. Factor Analysis.
Here we provide a sample output from the UNISTAT Excel statistics add-in for data analysis.
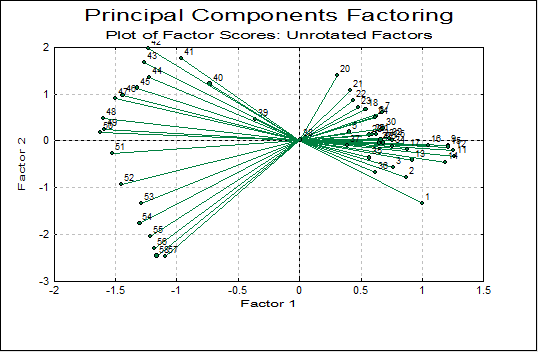
Principal Components Factoring: Unrotated Factors
Variables Selected: Wages, Energy, Interest, Fixed Capital, Sales1, Sales2,
Output1, Output2
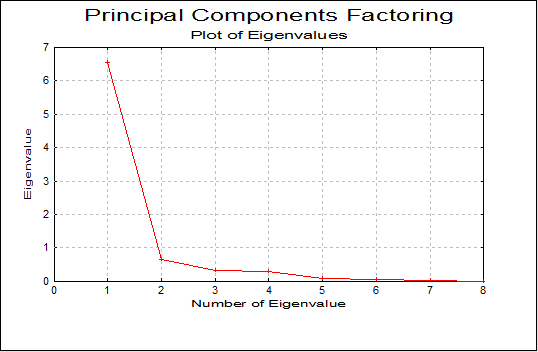
Variance Table
| Communality | Factor | Eigenvalue | Percent | Cumulative | |
|---|---|---|---|---|---|
| Wages | 0.9423 | 1 | 6.5447 | 81.8% | 81.8% |
| Energy | 0.9145 | 2 | 0.6600 | 8.3% | 90.1% |
| Interest | 0.9154 | ||||
| Fixed Capital | 0.9282 | ||||
| Sales1 | 0.8992 | ||||
| Sales2 | 0.9086 | ||||
| Output1 | 0.8006 | ||||
| Output2 | 0.8961 |
Factor Matrix
| Factor 1 | Factor 2 | |
|---|---|---|
| Wages | 0.9604 | 0.1409 |
| Energy | 0.9558 | 0.0318 |
| Interest | 0.9503 | 0.1106 |
| Fixed Capital | 0.9586 | 0.0962 |
| Sales1 | 0.9190 | -0.2335 |
| Sales2 | 0.8738 | -0.3808 |
| Output1 | 0.8452 | -0.2937 |
| Output2 | 0.7511 | 0.5761 |
Factor Score Coefficients
| Factor 1 | Factor 2 | |
|---|---|---|
| Wages | 0.1468 | 0.2134 |
| Energy | 0.1460 | 0.0482 |
| Interest | 0.1452 | 0.1675 |
| Fixed Capital | 0.1465 | 0.1457 |
| Sales1 | 0.1404 | -0.3538 |
| Sales2 | 0.1335 | -0.5769 |
| Output1 | 0.1291 | -0.4450 |
| Output2 | 0.1148 | 0.8728 |
Factor Scores
| Factor 1 | Factor 2 | |
|---|---|---|
| 1 | 1.0007 | -1.3425 |
| 2 | 0.8707 | -0.7798 |
| 3 | 0.7651 | -0.5722 |
| 4 | 0.6609 | -0.0564 |
| 5 | 0.4032 | 0.1879 |
| 6 | 0.6223 | 0.5168 |
| 7 | 0.6722 | 0.6000 |
| 8 | * | * |
| 9 | 1.2121 | -0.1012 |
| 10 | * | * |
| 11 | 1.2620 | -0.3367 |
| 12 | 1.2512 | -0.2127 |
| 13 | 0.9179 | -0.4104 |
| 14 | 1.1905 | -0.4580 |
| 15 | 1.2150 | -0.1322 |
| 16 | 1.0526 | -0.0986 |
| 17 | 0.8808 | -0.1898 |
| 18 | 0.5395 | 0.6690 |
| 19 | * | * |
| 20 | 0.3059 | 1.3912 |
| 21 | 0.4159 | 1.0781 |
| 22 | 0.4403 | 0.8597 |
| 23 | 0.4821 | 0.7080 |
| 24 | 0.6169 | 0.4979 |
| 25 | 0.7540 | 0.0028 |
| 26 | 0.6816 | -0.0436 |
| 27 | 0.6526 | -0.0437 |
| 28 | 0.5682 | 0.1243 |
| 29 | 0.5914 | 0.1450 |
| 30 | 0.6795 | 0.2721 |
| 31 | 0.6274 | 0.1370 |
| 32 | 0.7330 | 0.0561 |
| 33 | 0.6632 | 0.0213 |
| 34 | 0.7583 | -0.1252 |
| 35 | 0.5716 | -0.3642 |
| 36 | 0.6166 | -0.6680 |
| 37 | 0.3874 | -0.1058 |
| 38 | 0.0084 | 0.0192 |
| 39 | -0.3620 | 0.4561 |
| 40 | -0.7305 | 1.2140 |
| 41 | -0.9608 | 1.7578 |
| 42 | -1.2290 | 1.9796 |
| 43 | -1.2630 | 1.6831 |
| 44 | -1.2266 | 1.3543 |
| 45 | -1.3225 | 1.1289 |
| 46 | -1.4386 | 0.9648 |
| 47 | -1.5001 | 0.9078 |
| 48 | -1.6007 | 0.4776 |
| 49 | -1.5911 | 0.2496 |
| 50 | -1.6205 | 0.1733 |
| 51 | -1.5273 | -0.2702 |
| 52 | -1.4509 | -0.9380 |
| 53 | -1.2872 | -1.3424 |
| 54 | -1.3017 | -1.7653 |
| 55 | -1.2180 | -2.0433 |
| 56 | -1.1812 | -2.3027 |
| 57 | -1.0963 | -2.4693 |
| 58 | -1.1630 | -2.4610 |
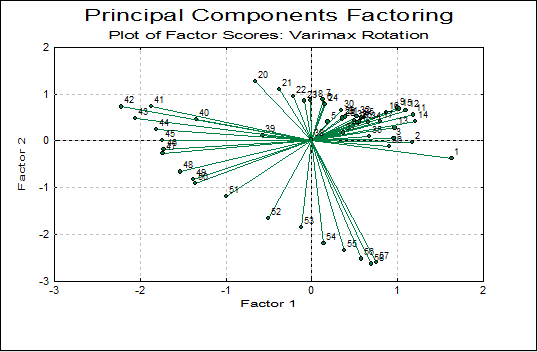
Principal Components Factoring: Varimax Rotation
Rotated Factor Matrix
| Factor 1 | Factor 2 | |
|---|---|---|
| Wages | 0.6447 | 0.7257 |
| Energy | 0.7113 | 0.6392 |
| Interest | 0.6564 | 0.6960 |
| Fixed Capital | 0.6720 | 0.6903 |
| Sales1 | 0.8538 | 0.4125 |
| Sales2 | 0.9140 | 0.2707 |
| Output1 | 0.8360 | 0.3189 |
| Output2 | 0.2044 | 0.9243 |
Final Communalities
| Communality | |
|---|---|
| Wages | 0.9423 |
| Energy | 0.9145 |
| Interest | 0.9154 |
| Fixed Capital | 0.9282 |
| Sales1 | 0.8992 |
| Sales2 | 0.9086 |
| Output1 | 0.8006 |
| Output2 | 0.8961 |
Factor Transition Matrix
| Factor 1 | Factor 2 | |
|---|---|---|
| Factor 1 | 0.7656 | 0.6434 |
| Factor 2 | -0.6434 | 0.7656 |
Factor Score Coefficients
| Factor 1 | Factor 2 | |
|---|---|---|
| Wages | -0.0249 | 0.2578 |
| Energy | 0.0808 | 0.1308 |
| Interest | 0.0034 | 0.2216 |
| Fixed Capital | 0.0184 | 0.2058 |
| Sales1 | 0.3351 | -0.1805 |
| Sales2 | 0.4734 | -0.3558 |
| Output1 | 0.3852 | -0.2576 |
| Output2 | -0.4737 | 0.7421 |
Factor Scores
| Factor 1 | Factor 2 | |
|---|---|---|
| 1 | 1.6298 | -0.3840 |
| 2 | 1.1683 | -0.0369 |
| 3 | 0.9539 | 0.0541 |
| 4 | 0.5423 | 0.3820 |
| 5 | 0.1878 | 0.4033 |
| 6 | 0.1439 | 0.7960 |
| 7 | 0.1286 | 0.8918 |
| 8 | * | * |
| 9 | 0.9930 | 0.7024 |
| 10 | * | * |
| 11 | 1.1828 | 0.5542 |
| 12 | 1.0947 | 0.6421 |
| 13 | 0.9667 | 0.2764 |
| 14 | 1.2060 | 0.4153 |
| 15 | 1.0152 | 0.6804 |
| 16 | 0.8693 | 0.6017 |
| 17 | 0.7964 | 0.4214 |
| 18 | -0.0174 | 0.8592 |
| 19 | * | * |
| 20 | -0.6608 | 1.2619 |
| 21 | -0.3752 | 1.0930 |
| 22 | -0.2160 | 0.9415 |
| 23 | -0.0864 | 0.8522 |
| 24 | 0.1520 | 0.7781 |
| 25 | 0.5755 | 0.4872 |
| 26 | 0.5498 | 0.4051 |
| 27 | 0.5277 | 0.3864 |
| 28 | 0.3551 | 0.4607 |
| 29 | 0.3594 | 0.4915 |
| 30 | 0.3451 | 0.6454 |
| 31 | 0.3922 | 0.5085 |
| 32 | 0.5251 | 0.5145 |
| 33 | 0.4940 | 0.4430 |
| 34 | 0.6611 | 0.3920 |
| 35 | 0.6719 | 0.0889 |
| 36 | 0.9018 | -0.1147 |
| 37 | 0.3646 | 0.1683 |
| 38 | -0.0060 | 0.0201 |
| 39 | -0.5705 | 0.1163 |
| 40 | -1.3403 | 0.4595 |
| 41 | -1.8664 | 0.7276 |
| 42 | -2.2145 | 0.7248 |
| 43 | -2.0497 | 0.4760 |
| 44 | -1.8104 | 0.2477 |
| 45 | -1.7387 | 0.0135 |
| 46 | -1.7221 | -0.1869 |
| 47 | -1.7325 | -0.2701 |
| 48 | -1.5328 | -0.6642 |
| 49 | -1.3787 | -0.8325 |
| 50 | -1.3521 | -0.9098 |
| 51 | -0.9954 | -1.1895 |
| 52 | -0.5073 | -1.6516 |
| 53 | -0.1218 | -1.8558 |
| 54 | 0.1392 | -2.1889 |
| 55 | 0.3821 | -2.3479 |
| 56 | 0.5771 | -2.5228 |
| 57 | 0.7493 | -2.5958 |
| 58 | 0.6929 | -2.6323 |

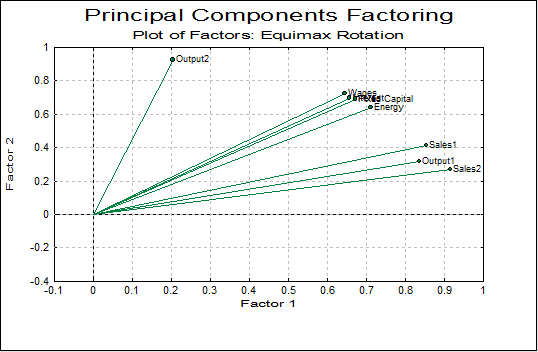
Principal Components Factoring: Equimax Rotation
Rotated Factor Matrix
| Factor 1 | Factor 2 | |
|---|---|---|
| Wages | 0.6447 | 0.7257 |
| Energy | 0.7113 | 0.6392 |
| Interest | 0.6564 | 0.6960 |
| Fixed Capital | 0.6720 | 0.6903 |
| Sales1 | 0.8538 | 0.4125 |
| Sales2 | 0.9140 | 0.2707 |
| Output1 | 0.8360 | 0.3189 |
| Output2 | 0.2044 | 0.9243 |
Final Communalities
| Communality | |
|---|---|
| Wages | 0.9423 |
| Energy | 0.9145 |
| Interest | 0.9154 |
| Fixed Capital | 0.9282 |
| Sales1 | 0.8992 |
| Sales2 | 0.9086 |
| Output1 | 0.8006 |
| Output2 | 0.8961 |
Factor Transition Matrix
| Factor 1 | Factor 2 | |
|---|---|---|
| Factor 1 | 0.7656 | 0.6434 |
| Factor 2 | -0.6434 | 0.7656 |
Factor Score Coefficients
| Factor 1 | Factor 2 | |
|---|---|---|
| Wages | -0.0249 | 0.2578 |
| Energy | 0.0808 | 0.1308 |
| Interest | 0.0034 | 0.2216 |
| Fixed Capital | 0.0184 | 0.2058 |
| Sales1 | 0.3351 | -0.1805 |
| Sales2 | 0.4734 | -0.3558 |
| Output1 | 0.3852 | -0.2576 |
| Output2 | -0.4737 | 0.7421 |
Factor Scores
| Factor 1 | Factor 2 | |
|---|---|---|
| 1 | 1.6298 | -0.3840 |
| 2 | 1.1683 | -0.0369 |
| 3 | 0.9539 | 0.0541 |
| 4 | 0.5423 | 0.3820 |
| 5 | 0.1878 | 0.4033 |
| 6 | 0.1439 | 0.7960 |
| 7 | 0.1286 | 0.8918 |
| 8 | * | * |
| 9 | 0.9930 | 0.7024 |
| 10 | * | * |
| 11 | 1.1828 | 0.5542 |
| 12 | 1.0947 | 0.6421 |
| 13 | 0.9667 | 0.2764 |
| 14 | 1.2060 | 0.4153 |
| 15 | 1.0152 | 0.6804 |
| 16 | 0.8693 | 0.6017 |
| 17 | 0.7964 | 0.4214 |
| 18 | -0.0174 | 0.8592 |
| 19 | * | * |
| 20 | -0.6608 | 1.2619 |
| 21 | -0.3752 | 1.0930 |
| 22 | -0.2160 | 0.9415 |
| 23 | -0.0864 | 0.8522 |
| 24 | 0.1520 | 0.7781 |
| 25 | 0.5755 | 0.4872 |
| 26 | 0.5498 | 0.4051 |
| 27 | 0.5277 | 0.3864 |
| 28 | 0.3551 | 0.4607 |
| 29 | 0.3594 | 0.4915 |
| 30 | 0.3451 | 0.6454 |
| 31 | 0.3922 | 0.5085 |
| 32 | 0.5251 | 0.5145 |
| 33 | 0.4940 | 0.4430 |
| 34 | 0.6611 | 0.3920 |
| 35 | 0.6719 | 0.0889 |
| 36 | 0.9018 | -0.1147 |
| 37 | 0.3646 | 0.1683 |
| 38 | -0.0060 | 0.0201 |
| 39 | -0.5705 | 0.1163 |
| 40 | -1.3403 | 0.4595 |
| 41 | -1.8664 | 0.7276 |
| 42 | -2.2145 | 0.7248 |
| 43 | -2.0497 | 0.4760 |
| 44 | -1.8104 | 0.2477 |
| 45 | -1.7387 | 0.0135 |
| 46 | -1.7221 | -0.1869 |
| 47 | -1.7325 | -0.2701 |
| 48 | -1.5328 | -0.6642 |
| 49 | -1.3787 | -0.8325 |
| 50 | -1.3521 | -0.9098 |
| 51 | -0.9954 | -1.1895 |
| 52 | -0.5073 | -1.6516 |
| 53 | -0.1218 | -1.8558 |
| 54 | 0.1392 | -2.1889 |
| 55 | 0.3821 | -2.3479 |
| 56 | 0.5771 | -2.5228 |
| 57 | 0.7493 | -2.5958 |
| 58 | 0.6929 | -2.6323 |

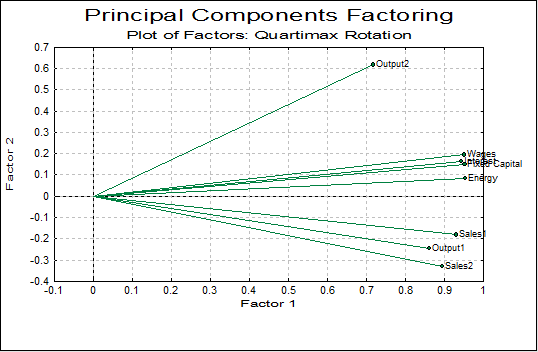
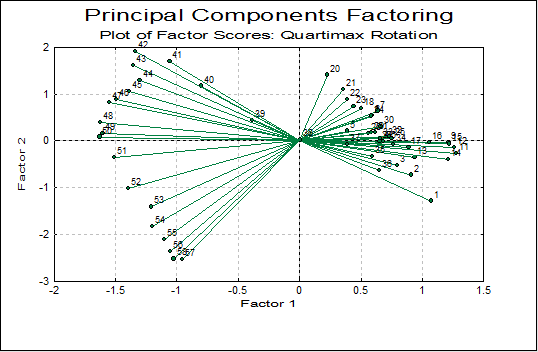
Principal Components Factoring: Quartimax Rotation
Rotated Factor Matrix
| Factor 1 | Factor 2 | |
|---|---|---|
| Wages | 0.9511 | 0.1942 |
| Energy | 0.9525 | 0.0850 |
| Interest | 0.9427 | 0.1634 |
| Fixed Capital | 0.9517 | 0.1495 |
| Sales1 | 0.9306 | -0.1819 |
| Sales2 | 0.8937 | -0.3315 |
| Output1 | 0.8602 | -0.2461 |
| Output2 | 0.7178 | 0.6171 |
Final Communalities
| Communality | |
|---|---|
| Wages | 0.9423 |
| Energy | 0.9145 |
| Interest | 0.9154 |
| Fixed Capital | 0.9282 |
| Sales1 | 0.8992 |
| Sales2 | 0.9086 |
| Output1 | 0.8006 |
| Output2 | 0.8961 |
Factor Transition Matrix
| Factor 1 | Factor 2 | |
|---|---|---|
| Factor 1 | 0.9984 | 0.0558 |
| Factor 2 | -0.0558 | 0.9984 |
Factor Score Coefficients
| Factor 1 | Factor 2 | |
|---|---|---|
| Wages | 0.1346 | 0.2213 |
| Energy | 0.1431 | 0.0562 |
| Interest | 0.1356 | 0.1753 |
| Fixed Capital | 0.1381 | 0.1536 |
| Sales1 | 0.1599 | -0.3454 |
| Sales2 | 0.1655 | -0.5686 |
| Output1 | 0.1538 | -0.4371 |
| Output2 | 0.0659 | 0.8779 |
Factor Scores
| Factor 1 | Factor 2 | |
|---|---|---|
| 1 | 1.0740 | -1.2846 |
| 2 | 0.9128 | -0.7301 |
| 3 | 0.7958 | -0.5287 |
| 4 | 0.6630 | -0.0194 |
| 5 | 0.3921 | 0.2101 |
| 6 | 0.5925 | 0.5507 |
| 7 | 0.6377 | 0.6366 |
| 8 | * | * |
| 9 | 1.2159 | -0.0334 |
| 10 | * | * |
| 11 | 1.2788 | -0.2657 |
| 12 | 1.2611 | -0.1426 |
| 13 | 0.9394 | -0.3585 |
| 14 | 1.2142 | -0.3909 |
| 15 | 1.2204 | -0.0642 |
| 16 | 1.0564 | -0.0397 |
| 17 | 0.8900 | -0.1404 |
| 18 | 0.5013 | 0.6980 |
| 19 | * | * |
| 20 | 0.2279 | 1.4061 |
| 21 | 0.3552 | 1.0996 |
| 22 | 0.3917 | 0.8830 |
| 23 | 0.4418 | 0.7338 |
| 24 | 0.5882 | 0.5315 |
| 25 | 0.7527 | 0.0448 |
| 26 | 0.6829 | -0.0055 |
| 27 | 0.6540 | -0.0073 |
| 28 | 0.5604 | 0.1558 |
| 29 | 0.5824 | 0.1778 |
| 30 | 0.6632 | 0.3096 |
| 31 | 0.6187 | 0.1717 |
| 32 | 0.7288 | 0.0969 |
| 33 | 0.6610 | 0.0583 |
| 34 | 0.7641 | -0.0827 |
| 35 | 0.5910 | -0.3318 |
| 36 | 0.6529 | -0.6325 |
| 37 | 0.3927 | -0.0840 |
| 38 | 0.0073 | 0.0197 |
| 39 | -0.3869 | 0.4352 |
| 40 | -0.7970 | 1.1714 |
| 41 | -1.0573 | 1.7014 |
| 42 | -1.3376 | 1.9079 |
| 43 | -1.3549 | 1.6100 |
| 44 | -1.3003 | 1.2838 |
| 45 | -1.3834 | 1.0534 |
| 46 | -1.4902 | 0.8831 |
| 47 | -1.5484 | 0.8227 |
| 48 | -1.6249 | 0.3876 |
| 49 | -1.6026 | 0.1605 |
| 50 | -1.6276 | 0.0827 |
| 51 | -1.5098 | -0.3550 |
| 52 | -1.3963 | -1.0175 |
| 53 | -1.2103 | -1.4121 |
| 54 | -1.2012 | -1.8352 |
| 55 | -1.1021 | -2.1080 |
| 56 | -1.0510 | -2.3650 |
| 57 | -0.9569 | -2.5266 |
| 58 | -1.0239 | -2.5220 |
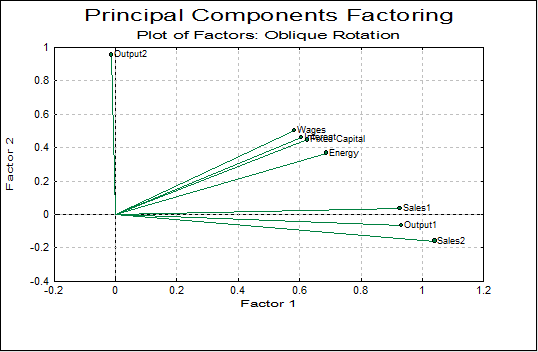
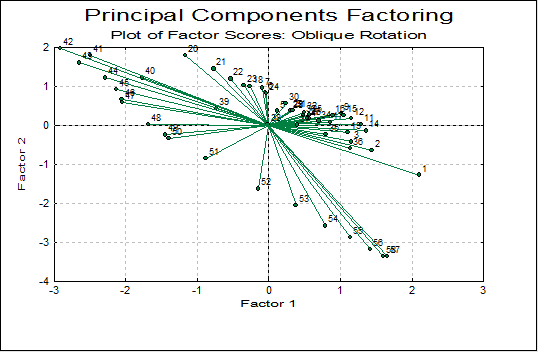
Principal Components Factoring: Oblique Rotation
Rotated Factor Matrix
| Factor 1 | Factor 2 | |
|---|---|---|
| Wages | 0.5824 | 0.5006 |
| Energy | 0.6884 | 0.3673 |
| Interest | 0.6052 | 0.4605 |
| Fixed Capital | 0.6259 | 0.4460 |
| Sales1 | 0.9271 | 0.0343 |
| Sales2 | 1.0410 | -0.1591 |
| Output1 | 0.9319 | -0.0639 |
| Output2 | -0.0125 | 0.9541 |
Structure Matrix
| Factor 1 | Factor 2 | |
|---|---|---|
| Wages | 0.8851 | 0.8527 |
| Energy | 0.9105 | 0.7835 |
| Interest | 0.8837 | 0.8265 |
| Fixed Capital | 0.8955 | 0.8244 |
| Sales1 | 0.9479 | 0.5949 |
| Sales2 | 0.9447 | 0.4703 |
| Output1 | 0.8933 | 0.4997 |
| Output2 | 0.5645 | 0.9466 |
Factor Correlation Matrix
| Factor 1 | Factor 2 | |
|---|---|---|
| Factor 1 | 1.0000 | 0.6047 |
| Factor 2 | 0.6047 | 1.0000 |
Factor Score Coefficients
| Factor 1 | Factor 2 | |
|---|---|---|
| Wages | -0.1037 | 0.3082 |
| Energy | 0.0617 | 0.1084 |
| Interest | -0.0588 | 0.2522 |
| Fixed Capital | -0.0359 | 0.2263 |
| Sales1 | 0.4611 | -0.3789 |
| Sales2 | 0.6800 | -0.6507 |
| Output1 | 0.5442 | -0.4929 |
| Output2 | -0.7900 | 1.0934 |
Factor Scores
| Factor 1 | Factor 2 | |
|---|---|---|
| 1 | 2.1023 | -1.2767 |
| 2 | 1.4393 | -0.6420 |
| 3 | 1.1512 | -0.4277 |
| 4 | 0.5547 | 0.1593 |
| 5 | 0.1152 | 0.3657 |
| 6 | -0.0500 | 0.8382 |
| 7 | -0.0960 | 0.9558 |
| 8 | * | * |
| 9 | 1.0151 | 0.2950 |
| 10 | * | * |
| 11 | 1.2892 | 0.0278 |
| 12 | 1.1566 | 0.1737 |
| 13 | 1.1038 | -0.1796 |
| 14 | 1.3571 | -0.1434 |
| 15 | 1.0484 | 0.2585 |
| 16 | 0.8923 | 0.2431 |
| 17 | 0.8544 | 0.0739 |
| 18 | -0.2652 | 0.9934 |
| 19 | * | * |
| 20 | -1.1665 | 1.7851 |
| 21 | -0.7692 | 1.4449 |
| 22 | -0.5315 | 1.1896 |
| 23 | -0.3477 | 1.0208 |
| 24 | -0.0350 | 0.8135 |
| 25 | 0.5655 | 0.2628 |
| 26 | 0.5575 | 0.1819 |
| 27 | 0.5357 | 0.1718 |
| 28 | 0.3035 | 0.3456 |
| 29 | 0.3000 | 0.3786 |
| 30 | 0.2388 | 0.5624 |
| 31 | 0.3353 | 0.3813 |
| 32 | 0.4961 | 0.3199 |
| 33 | 0.4784 | 0.2540 |
| 34 | 0.6973 | 0.1097 |
| 35 | 0.7965 | -0.2431 |
| 36 | 1.1355 | -0.5944 |
| 37 | 0.3982 | 0.0056 |
| 38 | -0.0130 | 0.0261 |
| 39 | -0.7308 | 0.4261 |
| 40 | -1.7696 | 1.2145 |
| 41 | -2.4892 | 1.7918 |
| 42 | -2.9142 | 1.9673 |
| 43 | -2.6420 | 1.5977 |
| 44 | -2.2845 | 1.2132 |
| 45 | -2.1303 | 0.9081 |
| 46 | -2.0531 | 0.6699 |
| 47 | -2.0421 | 0.5799 |
| 48 | -1.6860 | 0.0259 |
| 49 | -1.4498 | -0.2461 |
| 50 | -1.3953 | -0.3483 |
| 51 | -0.8796 | -0.8519 |
| 52 | -0.1515 | -1.6319 |
| 53 | 0.3780 | -2.0639 |
| 54 | 0.7918 | -2.5795 |
| 55 | 1.1340 | -2.8863 |
| 56 | 1.4221 | -3.1869 |
| 57 | 1.6535 | -3.3589 |
| 58 | 1.5949 | -3.3718 |