1.3. Modes of Running UNISTAT
1.3.1. Stand-Alone Mode
Start UNISTAT from the Unistat 6.5 icon. Loading and initialising the program will take a few moments. When this is completed, the UNISTAT spreadsheet (Data Processor) will be displayed.
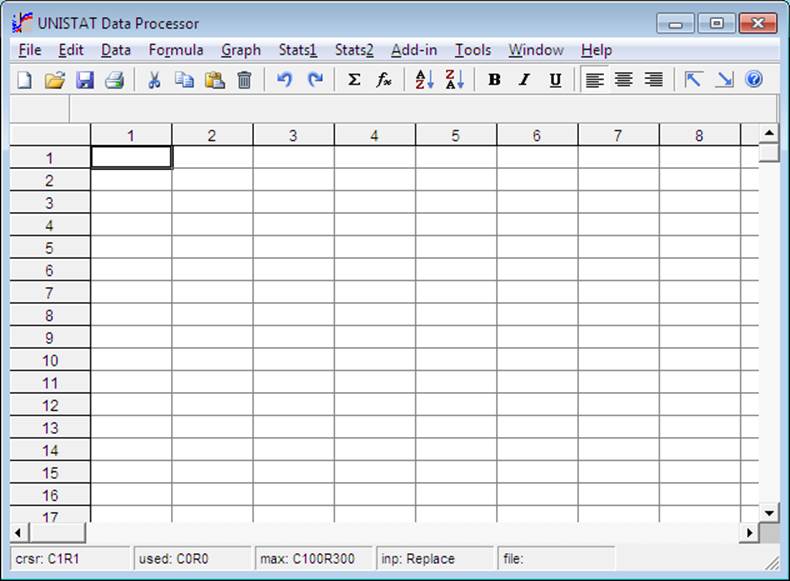
The top line of this window displays pull-down menu options for the Data Processor and is called the Menu Bar. The panel just under the Menu Bar contains a number of buttons and is called the Toolbar. The next line is used for text input and various prompts and will be referred to as the Input Panel. Note that in the above screen shot the Input Panel is currently inactive and so appears as simply a grey area. When it becomes active, a white text box with a flashing cursor will appear. At the very bottom of the window, information is displayed on certain Data Processor parameters. This area is called the Status Bar.
Before doing anything else, the new user of UNISTAT may wish to browse through the pull-down menu items and see what is available. Try moving the mouse over buttons on the toolbar. If the mouse pointer is held still over a button for a few seconds a short description of the button’s action will be displayed in a Tool Tip box.
At this stage there is no data in the spreadsheet to analyse. So, the available operations which can be performed are limited (such as Plot of Functions, Cumulative Probability and Sample Size and Power Estimation).
To enter data from keyboard, just type a number. This is done by typing directly into the current cell. Either press <Enter> or an arrow key or just click on another cell to complete the entry. To enter a column or row label, double-click on the label. A text editor will be placed on the Input Panel. Enter or edit the label. When finished, press <Enter> or click [OK].
As an exercise, you may like to open one of the example data files supplied with UNISTAT. To do this select Tools → Example Files. A standard Windows Open dialogue will appear allowing the selection of a data file. Then select DEMODATA. Because the Data Processor already contains some data which you may have just typed in the previous exercises, the program may ask you whether you wish to save the existing data to a file first, or to clear it. Selecting [No] will clear the existing data and the screen will be redrawn displaying the contents of the file DEMODATA.
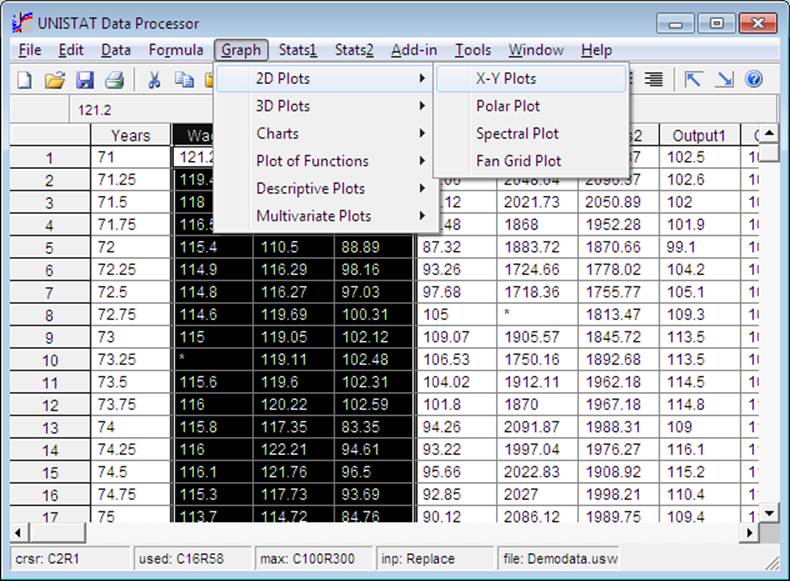
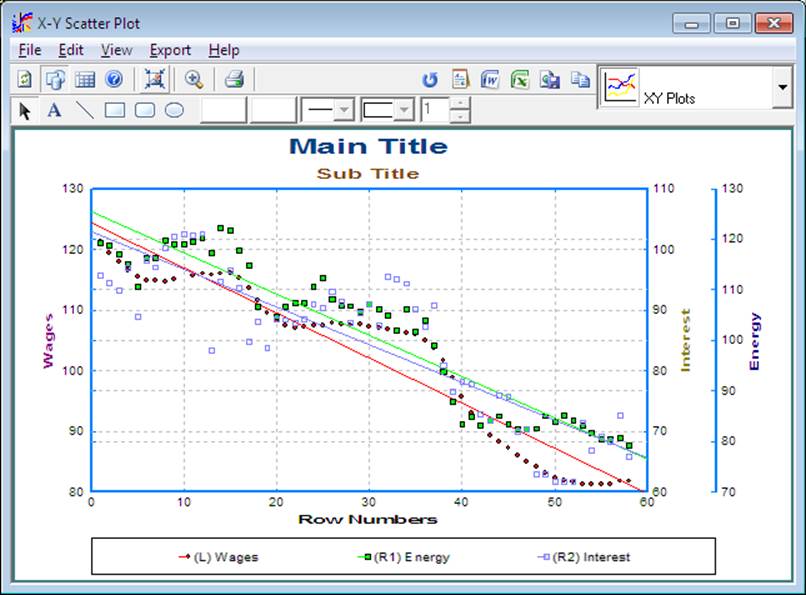
In order to draw a multiple line plot of the data columns Wages, Energy and Interest, move the mouse pointer to the label of Wages (where Wages appears on a grey background), press the left mouse button, drag the mouse pointer to the label of Interest and release the button. All three columns will be highlighted. Then select Graph → 2D Plots → X-Y Plots. A line graph of Wages, Energy and Interest will be plotted against the index (row numbers).
Highlighting spreadsheet columns first and then selecting a procedure will execute this procedure immediately with the default options. Suppose, for instance, that you wish to plot Wages, Energy and Interest against Years on the X-axis. To do this you will need to switch the highlighting off first (by simply clicking on any data cell) and then select Graph → 2D Plots → X-Y Plots. In this case, a dialogue will pop up allowing you to select specific columns for specific tasks. This is called a Variable Selection Dialogue and displays a list of all available variables on the left.
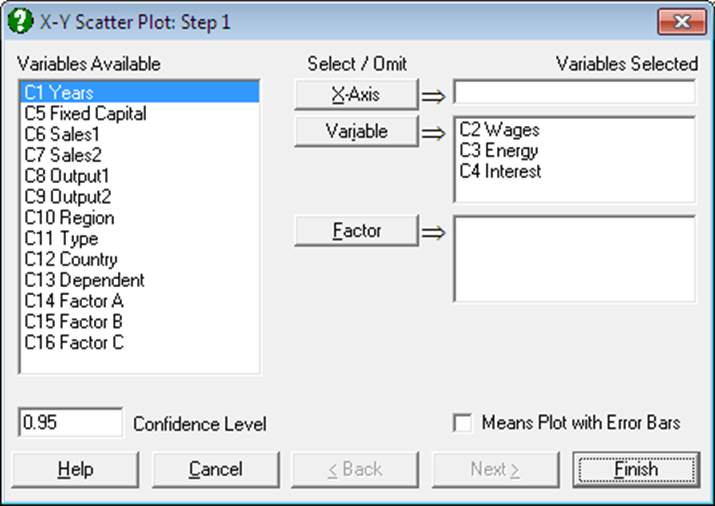
Highlight the first column Years by clicking on it and then select it as the X-axis variable by clicking on the [X Axis] button or pressing <Alt> + <X>. The Years variable will be transferred to the Variables Selected list on the right. Finally, to display the graph simply click on [Finish]. If a variable is selected by mistake, or you wish to de-select a variable for some other reason, you can highlight the variable in the Variables Selected list and click on its corresponding [Select / Omit] button.
1.3.2. Excel Add-In Mode
Start Excel using the Unistat 6.5 for Excel icon. This will start Excel with a new top level menu option Unistat which contains the new UNISTAT menu items Graphics, Statistics 1, Statistics 2 and Unistat Tools and a new UNISTAT toolbar. Bioassay is an optional module.
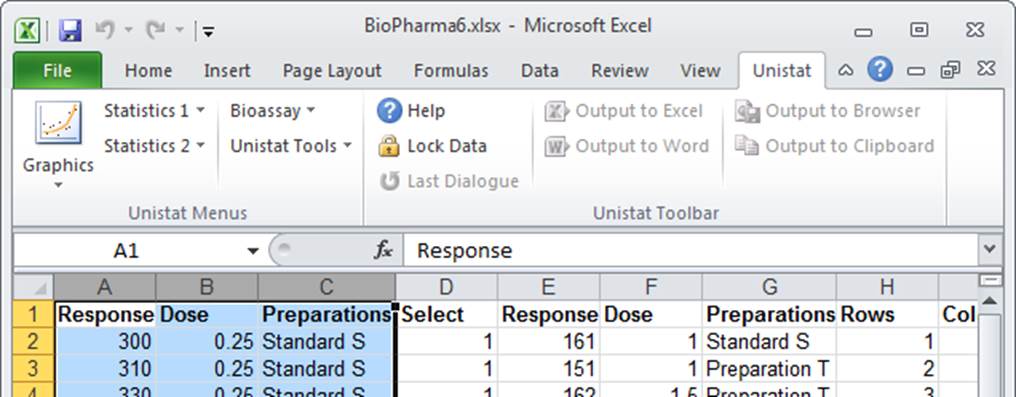
When the data in Excel is ready for analysis, highlight the block of cells you wish to analyse. In order to transfer the highlighted block to UNISTAT properly, it should conform to a few rules.
1) A column in the block should contain either numeric or String Data, but not a mixture of both (with the exception of Column Labels).
2) Row 1 of the block may contain Column Labels or data.
3) Column 1 of the block may contain Row Labels or data.
In most cases, the program will detect automatically whether the first row of the block contains Column Labels or data. If there is an ambiguity, a dialogue will pop up and ask for clarification.
Statistics: Suppose you wish to construct a table for the columns in the highlighted block, displaying basic statistical information. Select Statistics 1 → Descriptive Statistics → Summary Statistics to display UNISTAT’s Summary Statistics Variable Selection Dialogue. A list on the left (the Variables Available list) will show the columns in the highlighted block as C1, C2,…, and their labels, if any. Highlight the columns to be analysed and then click on the [Variable] button. The selected columns will be transferred to the Variables Selected list on the right. Then click on [Next] to display the Output Options Dialogue. Here you can select the statistics you want to display in the table. Finally, click [Finish] to send the output to a new worksheet in Excel.
Graphics: From UNISTAT menus select Graph → 2D Plots → X-Y Plots. If you did not disturb the highlighted data block in Excel data sheet, you will see the variables selected for the previous procedure still present in the Variables Selected list on the right. Clicking on [Finish], the graph will be displayed in UNISTAT Graphics Editor, where you can edit and customise it. When finished, click on the Excel button to send the graph to Excel. The top-left corner of the graphics object will be placed at the active cell of the active Excel sheet.
For further information see 2.2.0. Output Medium Toolbar and 2.2.3. Output to Excel. The Unistat Tools menu option provides access to UNISTAT setup options, macros, log file and example files (see 2.4. Tools).
1.3.3. Background Mode
It is possible to use UNISTAT from another application as a statistics and scientific graphics engine. By adding a few lines to the application (which can be in any language, including C++, VB, VBA) it is possible to start UNISTAT in the background mode, pass the data and instructions and receive results without any part of UNISTAT appearing on the screen.
A Developer’s Pack available from UNISTAT Ltd. contains a full description of all the calls and actions the developer needs to know.
