2.3.2. On-Screen Editing
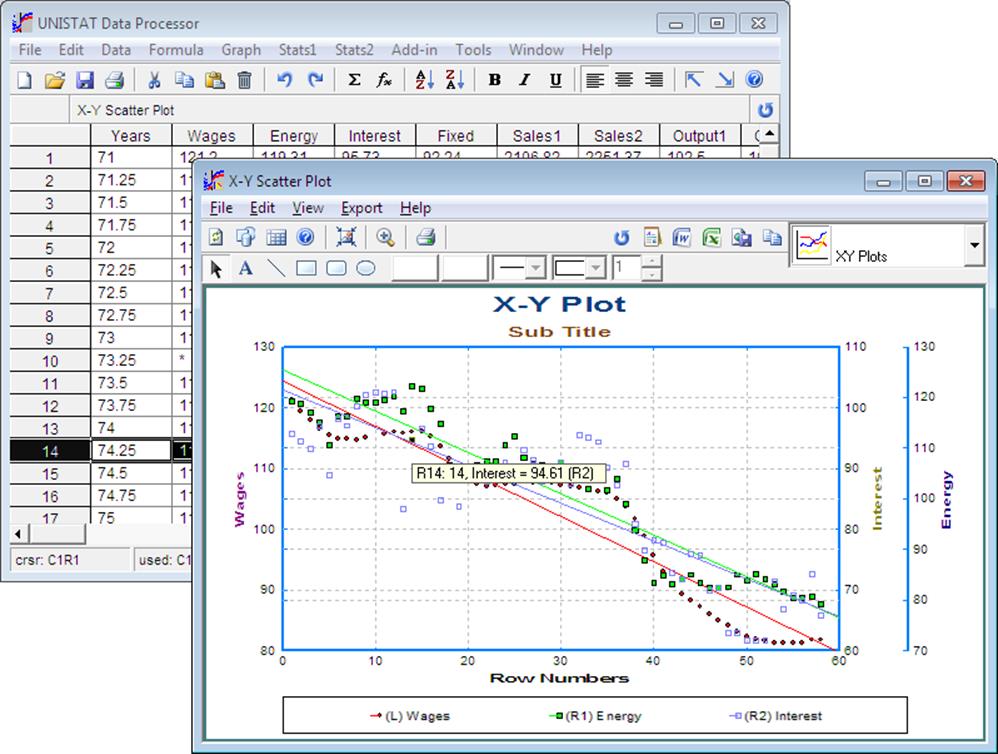
Graphics Editor allows for full on-screen object editing of graphs. All text, legends and the plot area can be drag-dropped and resized and new text, line and shape objects added.
2.3.2.1. Drawing Toolbar
![]()
When it is shipped, the Graphics Editor displays a Drawing Toolbar. This can be hidden using the View menu or by clicking on the second icon of the Graphics Toolbar. The buttons on this toolbar are used to add new text, line, rectangle, rounded rectangle, ellipse and circle objects. Other controls are used to change aspects of objects like border colour, fill colour, border style fill style and border thickness. These buttons have the following tasks:
![]() Select Mode: When this button is
depressed, the mouse pointer can be used to select objects either for
drag-dropping or other further processing. For example you need to select an
object before being able to change its border or background colour or border thickness.
Select Mode: When this button is
depressed, the mouse pointer can be used to select objects either for
drag-dropping or other further processing. For example you need to select an
object before being able to change its border or background colour or border thickness.
![]() Insert Text: Inserts a new text object
(see 2.3.2.2.4. Text Objects).
Insert Text: Inserts a new text object
(see 2.3.2.2.4. Text Objects).
![]() Draw Line: Draws a line object (see 2.3.2.2.5. Line Objects).
Draw Line: Draws a line object (see 2.3.2.2.5. Line Objects).
![]() Draw Rectangle: Draws a rectangle
object (see 2.3.2.2.6. Shape Objects).
Draw Rectangle: Draws a rectangle
object (see 2.3.2.2.6. Shape Objects).
![]() Draw Rounded Rectangle: Draws a rounded
rectangle object (see 2.3.2.2.6. Shape Objects).
Draw Rounded Rectangle: Draws a rounded
rectangle object (see 2.3.2.2.6. Shape Objects).
![]() Draw Ellipse: Draws an ellipse or
circle object (see 2.3.2.2.6. Shape Objects).
Draw Ellipse: Draws an ellipse or
circle object (see 2.3.2.2.6. Shape Objects).
![]() Border Colour: Selects the border colour of the currently selected legend, line or shape objects.
Border Colour: Selects the border colour of the currently selected legend, line or shape objects.
![]() Fill Colour: Selects the fill
(inside area) colour of the currently selected legend or shape objects.
Fill Colour: Selects the fill
(inside area) colour of the currently selected legend or shape objects.
![]() Border Style: Selects the border style
of the currently selected legend, line or shape objects.
Border Style: Selects the border style
of the currently selected legend, line or shape objects.
![]() Fill Style: Selects the fill (inside
area) style of the currently selected legend or shape objects.
Fill Style: Selects the fill (inside
area) style of the currently selected legend or shape objects.
![]() Border Thickness: This control permits
the selection of the border line thickness of the currently selected legend, line or shape objects. The thickness is in printer units, which is about 1/8 of a
pixel on the screen for a laser printer.
Border Thickness: This control permits
the selection of the border line thickness of the currently selected legend, line or shape objects. The thickness is in printer units, which is about 1/8 of a
pixel on the screen for a laser printer.
2.3.2.2. UNISTAT Graphics Objects
UNISTAT graphs consist of six types of objects; frame, plot area, legend, text, line and shape objects. The plot area, legend and some text objects are drawn by UNISTAT but additional text, line and shape objects can be added by the user. All objects, except for the plot area object, can be deleted by pressing <Delete> when the object is selected.
When an object is selected, eight small blocks will appear in the object’s bounding rectangle. These blocks are called handles. The objects can be resized by dragging these handles (except for text objects).
2.3.2.2.1. Frame Object
By default, the frame object will be drawn on the borders of the Graphics Editor window. This object has the lowest priority (i.e. it will always lie at the background). To select it, click on an exposed region in the graphics area which does not belong to any other object. Once the frame has been selected, you may change its line or fill colour, line style, etc. The fill colour of the frame object is the background colour of the entire graph area.
2.3.2.2.2. Plot Area Object
The entire plot area, including the axis numbers, is treated as one single object. You can select this object by clicking anywhere on the plot area.
The X-Y Plots type differs from other plot types in that its plot area object contains additional vertical lines for up to four right Y-axes. These lines have only one handle allowing a right Y-axis to be moved horizontally, confined by the neighbouring axes.
Unlike other objects, which are redrawn independently, any change in the plot area object will cause the entire window to be redrawn.
2.3.2.2.3. Legend Object
All information displayed on legends is contained within a single Legend Object. This can be drag-dropped and resized like an ordinary rectangle object. However, whenever a Legend Object is resized, its contents will be rearranged so that they make best use of the new shape of the legend.
In general, the text displayed in legends can be edited in custom dialogue boxes specific to each procedure. For instance the X-Y Plots Edit → Data Series dialogue, the Plot of 2D Functions Edit → Functions dialogue and the Plot of Distribution Functions Edit → Distributions dialogue will facilitate the editing of the text for each legend item.
Other aspects of legends (like the number of items per line, legend on / off and font name, colour, size and style of the text displayed) can be controlled from a Legend dialogue by either double-clicking on the legend object or by selecting Edit → Options → Legend from the menu.
2.3.2.2.4. Text Objects
The main title, sub title and axis titles are standard text objects. Additional text objects can be inserted using the [Text] button on the Drawing Toolbar. Click this button first to insert a new text object. The mouse pointer will change into an I-beam pointer. Then click on the spot where the text is to be inserted. This will open the text editing dialogue. Enter the text and click [OK] when finished.
All text objects can be drag-dropped anywhere in the window and edited by double-clicking on them.

UNISTAT text objects support Rich Text format. This means that it is possible to mix different fonts (including symbols) and subscripts and superscripts in any text object. It is also possible to copy and paste formatted text between UNISTAT text objects and Word and other Windows applications.

Buttons on the text editing dialogue’s toolbar allow editing all aspects of text objects such as font name, size and colour, bold, italic, underline, subscript, superscript, justify left centre or right, horizontal, vertical up, vertical down, top-to-bottom orientations, transparent / opaque background and the background fill colour when the background is not transparent.
The main, sub and axis titles are justified with respect to the axes they represent. The default location is Centre. The user-inserted text objects do not have this option. All text objects can be aligned in one of 0º, 90º or 270º rotations or top-to-bottom orientation. For best results only True Type fonts should be used. Text rotation is only supported for True Type fonts.
It is possible to change the font size for all text that appear on the graph proportionately. This includes text displayed on axes, legend, as well as all text objects. The default size is 125%. To change this value enter and edit the following line in Documents\Unistat10\Unistat10.ini file under the [Options] section:
FontLevelPct=125
2.3.2.2.5. Line Objects
Click on the [Draw Line] button on the Drawing Toolbar to draw a line object. The mouse pointer will change from an arrow into a cross-hair. Now depress the left mouse button on the spot for one of the ends of the line and drag the pointer to the point where the line should end and then release the mouse button. The selected line objects will have two handles (small black squares) displayed on either end. These handles can be subsequently drag-and-dropped to change the position and length of the line. An unselected line can be re-selected at any time by clicking anywhere along its length.
To delete a line object simply press <Delete> when the line is selected. The colour, style and thickness of a selected line object can be determined using controls provided on the Drawing Toolbar.
2.3.2.2.6. Shape Objects
The shape objects provided are rectangle, rounded rectangle and ellipse, all of which are drawn and edited in almost exactly the same way as a line object described in the previous section. When one of these buttons on the Drawing Toolbar is clicked, the mouse pointer will change from an arrow into a cross-hair. Press the left mouse button down where the top left (or bottom right) corner of the shape is to be placed and drag the pointer to the bottom right (or top left) corner and then release the mouse button.
Although these three shapes are all different, they have the same drag outline, which is a rectangle. When selected, these shape objects will have eight handles (small black squares) displayed on their corners and in the middle of their edges. Dragging and dropping these handles changes the position, size and aspect ratio of objects. An unselected shape object can be re-selected at any time by clicking anywhere within its bounding rectangle. To delete a shape object simply press <Delete> whilst that object is selected.
The border colour, fill colour, border style, fill style and border thickness of shape objects can be changed using the controls provided on the Drawing Toolbar.
2.3.2.3. Interactive Data Points
In the following graphics procedures, the data points displayed in Graphics Editor maintain a link with the data matrix.
Graph → 2D Plots →
Graph → 3D Plots →
Graph → Descriptive Plots →
Statistics 1 → Regression Analysis →
Bioassay →

The three regression plots where this facility is available are Plot of Actual and Fitted Values, Plot of Residuals and Normal Plot of Residuals (see 7.2.1.2. Linear Regression Output Options).
In these procedures, you can press the right mouse button on a data point and highlight it. If you do not release the mouse button for a little while, a panel displaying information about this particular point will pop up. When the mouse button is released, the highlights are switched off. This procedure is also known as Brushing or Point identification.
In Stand-Alone Mode, if the Data Processor window is exposed, you will also see that the row of the spreadsheet containing the point becomes highlighted. Conversely, it is possible to click on a row of the spreadsheet to highlight the points on the graph which belong to this row.
A useful feature here is the possibility of using <Delete> to exclude the highlighted case (row) from the graph. The program will first generate a Select Row column indicating which rows will be included in the graph and then the entire graph will be redrawn without this particular row. After exiting the graphics procedure, all other UNISTAT procedures will continue to exclude such points from the analysis. If you wish to enable all rows of the data matrix again, proceed as follows:
1) Stand-Alone Mode: Disable the Select Row column.
2) Excel Add-In Mode: Highlight a different block of data.
This feature is particularly useful in Regression Analysis or in X-Y Plots with a fitted regression line and confidence intervals. What is called interactive outlier rejection can easily be performed by omitting the cases which lie outside the desired confidence intervals.
The link between data points and the data matrix will no longer be available once the image is sent to another application (i.e. Output Window, Excel, Word, web browser).
