2.4.1. Options
Various global and peripheral parameters can be selected from a tabbed dialogue. In Stand-Alone Mode, this is accessible from the Data Processor menu item Tools. In Excel Add-In Mode, the [Options] button on the UNISTAT toolbar provides access to a similar dialogue, which excludes the Data Export / Import 2, Spreadsheet and Colours tabs.
If changes are made in one of the Options dialogues and the dialogue exited by clicking <Enter/OK>, all current options and parameters will be stored by the program.
2.4.1.1. Memory Management
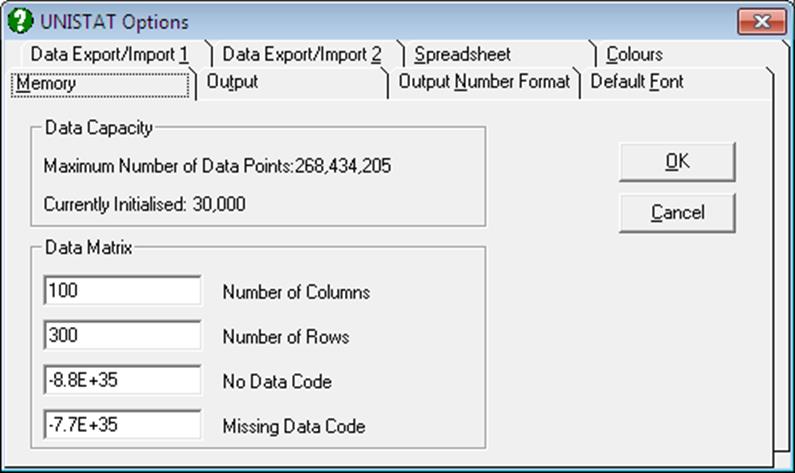
UNISTAT detects the free memory available in your system and displays the maximum number of data points that can be processed at any one time. The number of data points already initialised is also displayed in the group Data Capacity.
Each extra megabyte of free memory provides approximately 125,000 data points capacity (i.e. 8 bytes for each data point). There are no ad hoc limitations on the number of columns and rows. The dimensions of the data matrix can be set freely, provided that the number of cells in the matrix (i.e. number of columns times number of rows) does not exceed the maximum number of data points allowed.
The first two parameters in the second frame Data Matrix are used to set the dimensions of the data matrix and the latter two are for the No Data Code and Missing Data Code. Although you are allowed to change all these parameters any time during a session, the first three cannot be changed before clearing all data in the spreadsheet. If there is no data in the spreadsheet, then the new matrix will be initialised without further warning. Otherwise a prompt will ask you to confirm whether the data already in memory can be cleared first.
2.4.1.1.1. Number of Columns
This sets the maximum number of spreadsheet columns. The lower limit for this number is 4 and its upper limit depends on the total memory available on the system and the number of rows already selected. The exact number of columns that can be initialised is determined as follows:
4 ≤ MaxColNo ≤ Int(MaxPoints/(MaxRowNo+1)),
where MaxPoints is the maximum number of data points that can be processed at any one time, as reported at the top of the dialogue. Any numbers outside this range are not allowed. If this is attempted the program will display the valid range and wait for a valid entry. A higher number of columns than that allowed by the current number of rows can be set by reducing the number of rows to a sufficiently low level first, say 20, then entering the desired Number of Columns field, and going back to the Number of Rows field to see how many rows are allowed with this particular number of columns.
2.4.1.1.2. Number of Rows
This field is for setting the maximum number of rows that can be processed at a time. Its lower limit is 20. The exact number of rows that can be initialised is determined as follows:
20 ≤ MaxRowNo ≤ Int(MaxPoints/(MaxColNo-1)).
As in the case of setting the number of columns, a higher number of rows than that allowed by the current number of columns can be set by reducing the number of columns to a sufficiently low number first, say 4, then setting the Number of Rows field as desired, and going back to the Number of Columns field to see how many columns are allowed with this particular row number setting.
2.4.1.1.3. No Data Code
This value is used as a marker for cells that do not contain any data. When a data matrix is initialised, all its cells are assigned this value. It is highly unlikely that the need should ever arise to change the No Data Code. In the remote event of a data set containing this number, another number that will not interfere with the data can be entered. As in the case of the maximum number of data matrix columns and rows, any data in spreadsheet will be cleared when this parameter is changed.
2.4.1.1.4. Missing Data Code
Any cells having this value will be considered missing. A missing data cell is different from a blank cell (though this distinction is not observed by many applications, including Excel). During normal operation of the program, this value will be invisible to the user as a number. In Stand-Alone Mode, UNISTAT’s own spreadsheet represents a missing value by the asterisk (*) character. Any blank cells in a column, below which there are cells containing data, will be considered missing and filled with an asterisk automatically. In Excel Add-In Mode, you do not have to insert an asterisk into the missing data cells. UNISTAT will interpret blank cells within data columns as missing values. Ensure that such cells are truly blank and do not contain spaces or other invisible characters.
It is only when data files are exported or imported that the missing value code may be important (see 3.1.0. File Formats). For instance, in order to load a text file saved from a different application (or export data to a different application) the Missing Data Code may be changed to make it consistent with that of the external application. Also, in the remote event of data actually containing the missing value code as a data value, you will need to change it to a unique value which is not used as data.
The Missing Data Code can be changed when there is already data in the spreadsheet. In this case, the spreadsheet display will be refreshed, the cells containing the old Missing Data Code will show it as a number, and the cells containing the new Missing Data Code will show an asterisk. After the change, UNISTAT procedures will no longer recognise the cells with the previous code as missing and try to process these numbers as ordinary data. Because the default missing value is a very large negative number, in most cases the program will stop execution reporting a number overflow. To prevent this happening, change the value of the cells with the old Missing Data Code to the new one by means of the Data Processor’s Data → Recode Column procedure or the If() function (see 3.4.2.7. Conditional Functions).
2.4.1.2. Output
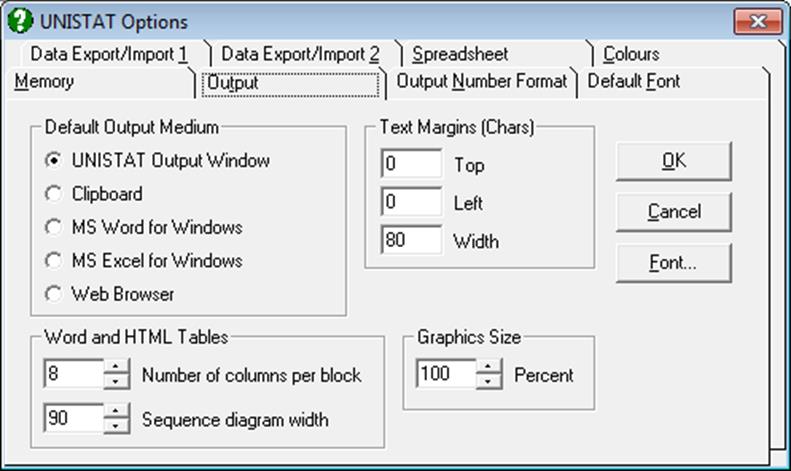
The Default Output Medium group on top left allows the user to set the destination for UNISTAT output. For the first two items (i.e. Output Window and the Clipboard) it is also possible to set the font and text margins using the [Font…] button and the Text Margins group of controls respectively.
The third group is used to set the number of columns per block in Word and web browser output.
2.4.1.2.1. Default Output Medium
All UNISTAT output will be sent to the selected application by default. For instance, if Word is installed and it is selected as the Default Output Medium, then all text and graphics output will be sent to Word. The output tables will be formatted in native Word table format. Similarly, when Excel is selected, all output is sent to Excel worksheets.
This dialogue is used to select the Default Output Medium, that is, the medium where output is first sent when a procedure is run. While any one of these applications is selected as the Default Output Medium, it will still be possible to send the same output to other applications in the list without having to run the procedure again. Suppose Output Window has been left as the Default Output Medium, since it is fast and it is also the accustomed type of output. In this case, after performing a procedure, the output will be sent to Output Window, but buttons on the Output Medium Toolbar will allow you to send the same output to other applications in the list. By clicking on the Word button, for instance, the same output will this time be sent to Word, in the form of a formatted Word table. In this way, Output Window – with its traditional fixed width font output – would function as the preview window, and only the final results would be sent to Word for inclusion in a report.
UNISTAT’s Graphics Editor also displays a similar Output Medium Toolbar for exporting graphics output to Word, Excel or the web browser. After customising a graph in UNISTAT Graphics Editor, the image can be sent to Word in enhanced metafile format by clicking on the Word button. Clicking on the Excel button will send it to Excel.
Output Window: The statistics (text) output is created in old style line printer format and thus should be viewed with a fixed-width font. The margins of the output can be controlled from the Text Margins group provided in the same dialogue. Graphics images are sent as enhanced metafile objects. See 2.2.1. UNISTAT Output Window.
The Clipboard: The text will be sent to the clipboard with a fixed-width font as in the above option.
Word for Windows: This option will be available only if Word 97 or a later version of Word is installed. If Word is not running already, it will be launched first. All output will be inserted into the current cursor position in the active document. See 2.2.2. Output to Word.
Excel for Windows: Only available when Excel 97 or a later version of Excel is installed. If Excel is not running already, it will be launched first. Each output page will be placed in a new worksheet. See 2.2.3. Output to Excel.
Web Browser: This option is only available if a web browser is installed. If the browser is not running already, it will be launched first. When the output is sent to the web browser for the first time, it will appear in the browser automatically. When this option is selected again subsequently, UNISTAT will ask whether you want to overwrite the existing output or append the new output to the existing HTML file. See 2.2.4. Output to Web Browser.
2.4.1.2.2. Font
The [Font…] button is used to select the type, style and size of the Output Window font. The font selected should be non-proportional, that is, a font with fixed character widths. The best results are obtained with Courier New True Type font.
2.4.1.2.3. Text Margins
It is possible to adjust the top and left margins in terms of number of lines and number of characters respectively.
Top: The number of lines between output from consecutive procedures.
Left: The number of characters left blank on the left.
Width: This field sets the width of the printed and file output in terms of number of characters per line. This number can be minimum 80 and maximum 32,000. Output will be re-scaled and large matrix output will be blocked accordingly. The resolution of character plots (i.e. character histogram, plot of residuals, fitted and actual y values, etc.) will also be determined by this number. For further information see 2.2.1. UNISTAT Output Window.
2.4.1.2.4. Word and HTML Tables
Number of columns per block: In Word and web browser output, large tables are parsed into blocks to facilitate easy viewing and / or printing. The default number of columns per block is 6, but you can change this to any number greater than 2. For more information see 2.2.2. Output to Word and 2.2.4. Output to Web Browser.
This option does not have any effect on the width of output in UNISTAT’s Output Window or in Excel (which is not blocked by default). For more information on how to change the width of output for these media see 2.2.1. UNISTAT Output Window and 2.2.3. Output to Excel.
Sequence diagram width: The width, and thus the resolution, of sequence (character) diagrams can be controlled.
2.4.1.2.5. Graphics Size
Although UNISTAT’s Graphics Editor is a resizeable window, graphics objects exported to output have a fixed size. However, it is possible to make the graphics objects appear smaller or bigger than the default size of 100% using this control.
2.4.1.3. Number Format
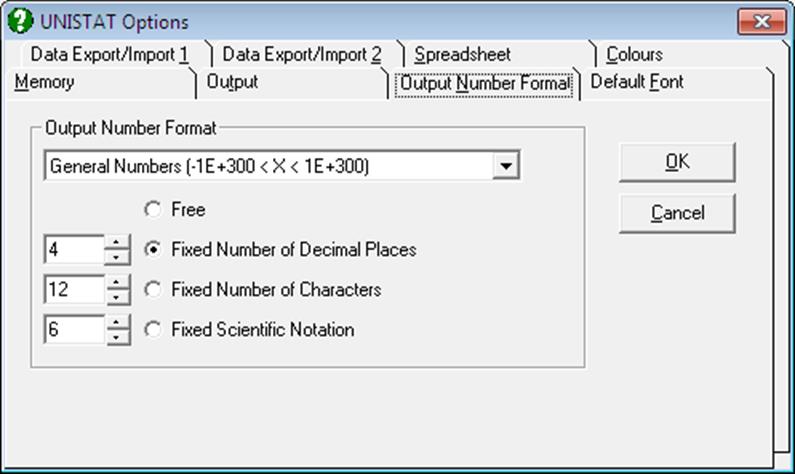
The number of digits displayed for floating point numbers in output can be controlled using this tab dialogue. You can also set the formats for the numbers displayed on the axes of graphs using a similar dialogue (see 2.3.4.4. Axes). Each axis can have its own format.
2.4.1.3.1. Options List
The numbers displayed in UNISTAT text output are classified into four groups;
General Numbers: These are the numbers that do not fall within one of the following categories and can have a range of -1E+300 to 1E+300.
Correlations and Probabilities: These are the numbers that are inherently confined to the interval of -1 to +1 and 0 to 1 respectively.
Confidence Intervals: These can be formatted separately.
ANOVA Tables: Sum of squares, mean square and F-statistic values can be formatted.
When a selection is made from this list, the options underneath will display the current settings for this selection.
2.4.1.3.2. Number Styles
A floating point number can be displayed in one of the following formats.
Free: Up to 15 digits will be displayed within the space allowed in the output. The position of the floating point for numbers in the same column will not necessarily be the same. Too large and too small numbers will be displayed in scientific (i.e. power) notation.
Fixed Number of Decimal Places: All numbers will be displayed with the same number of digits after the floating point. Therefore, the floating points of numbers in the same column will align properly. The numbers that do not have enough number of significant digits after the floating point will be padded with zeros.
Fixed Number of Characters: The number is displayed to fit in the selected width. The position of the floating point for numbers in the same column will not necessarily be the same. Too large and too small numbers will be displayed in scientific (i.e. power) notation.
Fixed Scientific Notation: The number is displayed in power notation (e.g. 1.00E-15). It is possible to format the mantissa to display a fixed number of digits. The number defined here is not the number of decimal places but that of the total number of characters for the mantissa, including the floating point.
2.4.1.4. Default Font
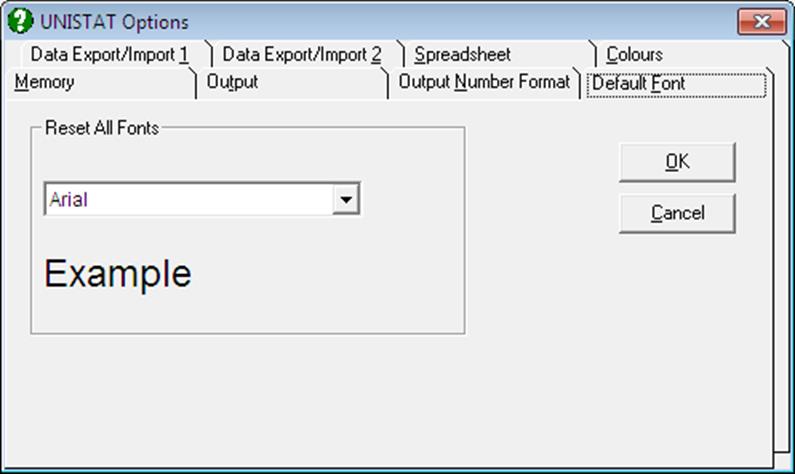
When UNISTAT is first installed, it will automatically scan the Windows system to determine which fonts are installed. It will then set a default font for all major windows of UNISTAT. This font will normally be Arial, except for the Output Window, which will have a fixed width font (normally Courier New).
However, if there are other fonts or if other applications that come with their own fonts (like Word) are installed subsequently, then some unsuitable fonts may be displayed when UNISTAT is started.
Select this option to reset all fonts in UNISTAT (i.e. Data Processor, Procedure Dialogues and all graphics fonts). The drop-down list displays available Windows fonts. Select any font from the list and click [OK]. The new font will become active immediately, and the new font settings will be stored by the program.
2.4.1.5. Data Export / Import 1
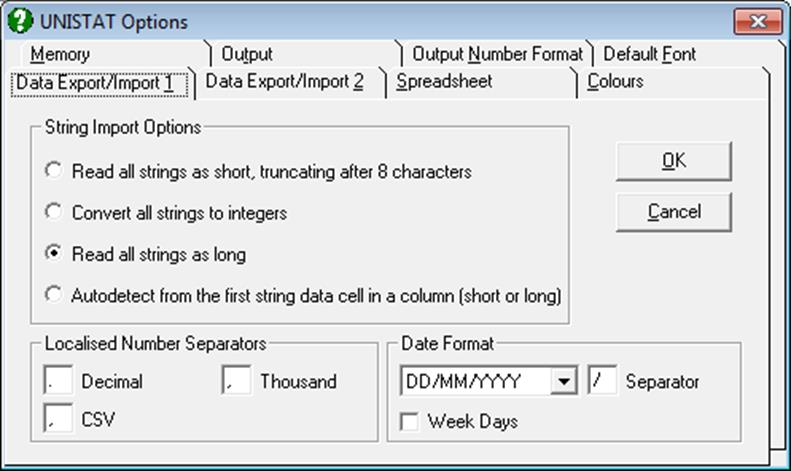
When opening data files or pasting data from the clipboard, the user can select one of the following four options which control the type of strings:
2.4.1.5.1. String Import Options
Read All Strings as Short: When this option is selected UNISTAT will treat all string variables as short and a Long String Table will not be created (see 3.0.2.2. String Data). The maximum length of a short string data cell is eight characters.
While this option is selected, it is still possible to read the first column of the file as Row Labels, which have no limitations on the number of characters. It is up to the user to read the first column of such a file as Row Labels or as the first column of data (see 2.4.1.6.2. Labels).
Advantages of reading short strings are summarised in section 3.0.2.2.1. Short Strings. When, however, the data to be imported contains String Data that are longer than eight characters, truncation may result in an unacceptable loss of variation. For instance, a string variable which has the rows Continent1, Continent2 will be read into UNISTAT as Continen, Continen, losing a vital variation in data. In such cases, the use of this option is not recommended and you will need to select one of the second or third options below.
Convert All Strings to Integers: When this option is selected, each distinct value in a string variable will be represented by an integer. The resulting column will thus be a numeric data column containing integers, but there will be no loss of variation due to truncation after the eighth character as in the above (Short Strings) option.
String values are represented by integers in the order of their appearance in the column. A Long String Table (see 3.0.2.2. String Data) is created, but no correspondence is established between the integers in a column and its strings in the table. With this option, the imported file will always contain only numeric data.
However, the user may then go to Edit → Long String Table, examine the string information, and establish the correspondence between columns containing integers and their string values by entering the function Long() for such columns (see 3.4.2.6.1. Data Conversion Functions).
The default dimensions for Long String Table are 200 columns and 2000 rows, meaning that the first 200 columns containing String Data, each of which containing no more than 2000 distinct values, will be translated. If these dimensions are not sufficient, select → Long String Table and increase the size of the table before opening the file.
Read All Strings as Long: This option is identical to the above option, except that the correspondence between integers and the Long String Table is established automatically, resulting in all strings in the incoming file being displayed in Data Processor.
Auto-detect: The program checks the first non-missing data in a column. If it is a string longer than eight characters, then the program will conclude that the column contains Long Strings. Once this is established, the rest of the entries in this column will be all treated as Long Strings whether they are shorter strings or they are numbers or dates.
If the first non-missing data in a column is a string and its length is less than or equal to eight characters, then the program will conclude that the column contains Short Strings. All the rest of the entries will be read as Short Strings and the ones longer than eight characters will be truncated. Truncation may result in loss of generality in a variable. In such cases, the use of this option is not recommended and the user should select one of the second or third options above.
2.4.1.5.2. Localised Number Separators
Decimal, thousand and CSV file field separators can be changed here. UNISTAT will automatically detect these parameters from the Windows environment every time it is started.
You are advised to change these parameters only when you need to override the default Windows settings. This may be necessary, for instance, when your default decimal separator is period and you receive a CSV file which was saved on a European Windows system. In this case, you can read the CSV file correctly by changing the decimal separator to comma, thousand separator to period, and the CSV file field separator to semicolon.
2.4.1.5.3. Date Format
As in the Localised Number Separators options above, UNISTAT will automatically detect these parameters from the Windows environment every time it is started. Use this facility only when you need to override the default Windows settings. This may be necessary when you need to import files saved from a Windows system with a different Date Format. The available date formats are:
dd/mm/yyyy
mm/dd/yyyy
yyyy/mm/dd
and any character can be selected as the date separator.
When the Week Day box is checked, dates are displayed including the day of the week, such as 29/02/2000 Tue. Otherwise, only the date is displayed.
For further information on the date and time data types see 3.0.2.3. Date Data and 3.0.2.5. Date-Time Data.
2.4.1.6. Data Export / Import 2
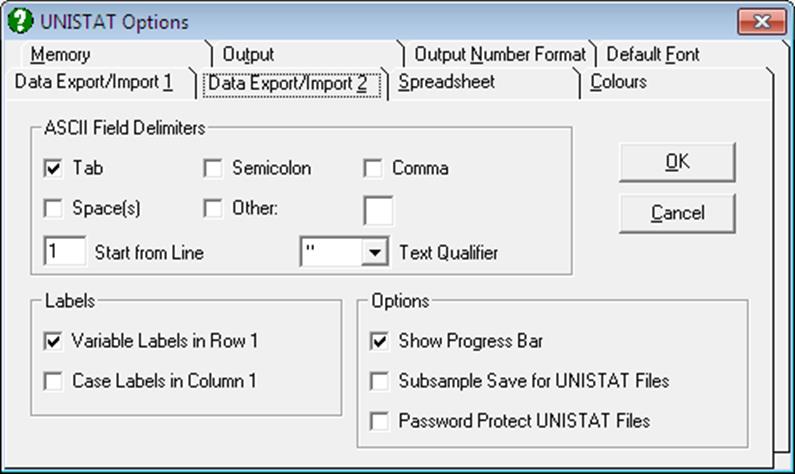
This dialogue is available in Stand-Alone Mode only (see 1.3. Modes of Running UNISTAT).
2.4.1.6.1. Text Field Delimiters
Delimiters: Tab, semicolon, comma or space(s) may be selected as the field delimiter, i.e. the character that separates different data points in the file. When more than one delimiter is selected, they will be effective simultaneously. The space character can also be selected as delimiter, but any number of contiguous spaces will be considered as one single separator. Clicking on the last check box, Other, enables the selection of any character of choice as the field delimiter. The selected field delimiter will be effective both in reading and saving text files (see 3.1.0.4. Delimited Text Files and 3.1.0.5. Free Format Text Files) and pasting the contents of the clipboard into Data Processor (see 3.2.5. Paste).
Start from Line: Some text files may contain some header information at the top of the file. By entering the line number to start from, you can read such files without having to edit them first.
Text Qualifier: Any characters enclosed between two characters shown in this control will be read as text (rather than numbers). There may not be a text qualifier, or it can be a single or double quote.
2.4.1.6.2. Labels
These check boxes are used by all data import and export procedures to control whether the Column Labels or Row Labels are included as part of files saved or loaded.
UNISTAT internal (.USW) files will always save and load all labels.
WARNING! When importing files, you should ensure that current settings of label options are consistent with the actual file. Otherwise the file may not be read correctly.
Column Labels in Row 1: When this box is checked, Column Labels will be saved as part of exported files. When loading or merging files, the first row of the imported file will be assumed to contain Column Labels.
Row Labels in Column 1: When this box is checked, Row Labels will be saved as part of exported files. When loading or merging files, the first column of the imported file will be assumed to contain Row Labels.
2.4.1.6.3. Options
Show Progress Bar: When opening or saving files, a progress bar on the Status Panel shows the percentage of the task performed. Uncheck this box in order not to display the progress bar.
Subsample Save for UNISTAT Files: UNISTAT internal files (.USW) will normally save all data contained in the Data Processor. However, this option will allow you to save only those rows of the data matrix which conform to a given logical condition. When this box is checked, you need to move the active cell to a factor column (i.e. a categorical variable) first. When the save option is selected the program will prompt you to enter a level (i.e. a value) of this factor column. Then only those rows of the whole data matrix containing this particular value in the factor column will be saved to the file. There is also an option to save all rows by entering an asterisk (*) in the input field, which is equivalent to leaving this subsample selection box unchecked.
There are several different ways of selecting subsamples from a data set. For instance, you can use the Data Processor’s Data → Select Row facility to mark rows to be included in subsequent analyses. You can use the If() (see 3.4.2.7. Conditional Functions) function to use a logical condition to generate a Select Row column. The Data → Recode Column facility can also be used.
It also possible to run UNISTAT procedures on subsamples of data, without having to edit the actual data matrix (see 2.1.2. Categorical Data Analysis).
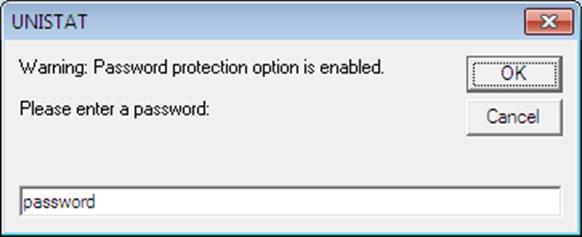
Password Protect UNISTAT Files: When this option is checked and an attempt is made to save UNISTAT internal (.USW files), a dialogue will pop up asking for a password. The password protected .USW files can only be retrieved by entering the correct password.
2.4.1.7. Spreadsheet
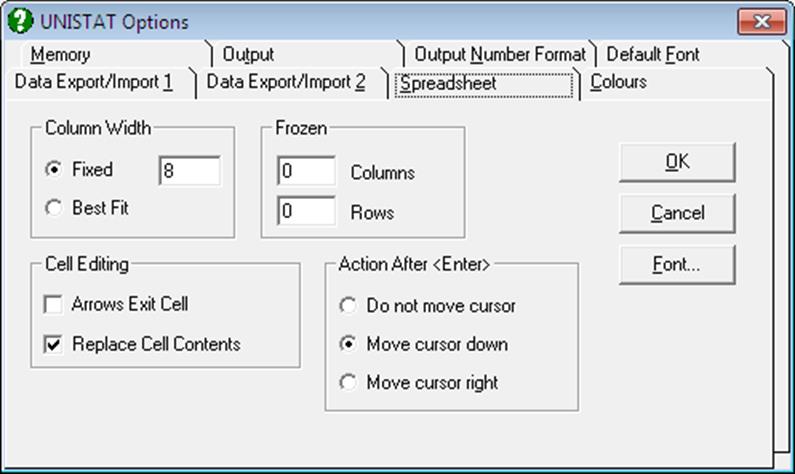
This dialogue is available in Stand-Alone Mode only (see 1.3. Modes of Running UNISTAT).
Various aspects of the spreadsheet, font type, style, size, column widths, frozen (non scrolling) columns and / or rows, and Cell Editing options can be selected from this dialogue.
2.4.1.7.1. Font
Click on the [Font…] button to activate the standard Windows font dialogue. Any fonts in any size can be selected and font attributes like bold, italic, underline, strikethrough can be set. All changes made will be saved as part of .USW files. The following rules will apply:
1) If no block of cells has been highlighted then the font of the current column will be set.
2) If a block of cells has been highlighted, then the font of the columns in the block will be set.
3) Any font selections will be valid for the printer if the font is True Type or it has a printer equivalent.
2.4.1.7.2. Column Width
A fixed column width (which can be determined by the user) can be set to the selected range of columns. Alternatively, the Best fit option will work out the optimum width for the selected columns automatically. You can also change the widths of highlighted columns by mouse, from the borders between Column Labels. All changes made in column widths will be saved as part of .USW files. The following rules will apply:
1) If no block of cells has been highlighted then the width of the current column will be set.
2) If a block of cells has been highlighted, then the widths of the columns in the block will be set.
3) Widths of non adjacent columns (multiple selections) cannot be set in one go.
2.4.1.7.3. Frozen
This option causes a fixed number of columns or rows to be displayed permanently on the screen. The so called frozen or nonscroll columns or rows will always be the first n columns or rows. These parameters will be saved as part of .USW files.
2.4.1.7.4. Cell Editing
The following options are available:
Arrows Exit Cell: When this box is checked, pressing an arrow key will terminate editing, and the active cell will move in the direction of arrow. Otherwise, arrow keys will move the blinking cursor along the edited text.
Replace Cell Contents: When this box is checked, any new text typed into a cell will replace the contents of the cell. Otherwise, the new text will be appended to the old text.
2.4.1.7.5. Action After <Enter>
This allows selecting the action to be taken after inputting data into a cell. The following options are available:
Do Not Move Cursor: The current cell remains to be the active cell.
Move Cursor Down: The next cell in the same column becomes the active cell.
Move Cursor Right: The next cell in the same row becomes the active cell.
2.4.1.8. Colours
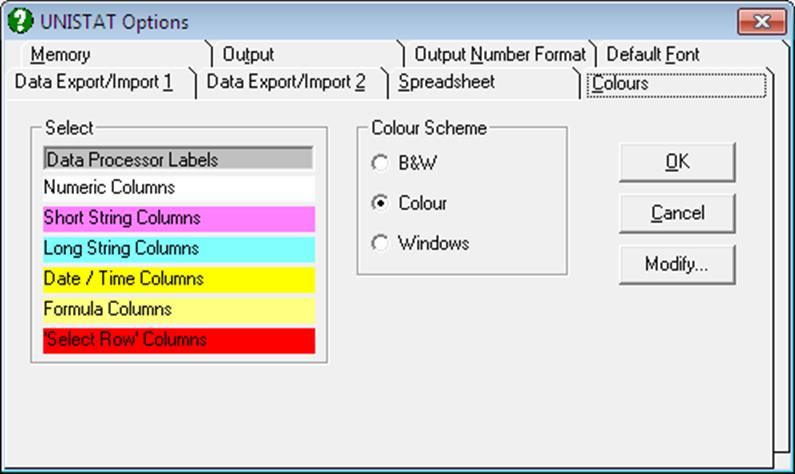
This dialogue is available in Stand-Alone Mode only (see 1.3. Modes of Running UNISTAT).
It is possible to select background colours for the most commonly used windows and switch colours off entirely.
2.4.1.8.1. Select Colours
Click on one of the items in the Select list to make it active, then click on the [Modify…] button. A standard Windows colour selection dialogue will be opened containing a palette of colours and tools for composing your own colours.
When all the colours are selected exit the dialogue pressing <Enter/OK>. New choices will become effective immediately. If the dialogue is exited by pressing <Esc/Cancel> the old colour will not be changed.
2.4.1.8.2. Colour Scheme
Black and White: When this option is selected, all colours will be displayed as black or white or as shades of grey.
Colour: This option will make the user-selected colour options active.
Windows: This option will detect the Windows environment’s colour settings and make them active in UNISTAT.
